Six years ago, the state of Wisconsin passed the highly controversial 2011 Wisconsin Act 10, which virtually eliminated collective bargaining rights for most public-sector workers, as well as slashed those workers’ benefits, among other changes. These attacks on public-sector workers are spreading throughout the country. Iowa recently passed an Act 10-inspired law with similar policies affecting public-sector workers and their unions.1 Other states and members of Congress are considering enacting such policies, and with its ruling on Janus v. American Federation of State, County, and Municipal Employees (AFSCME), the U.S. Supreme Court may act to weaken public-sector unions and teachers’ ability to collectively bargain.2
This issue brief examines the impact of the law on Wisconsin’s K-12 public education system and state economy. While this brief focuses on Act 10’s impact on Wisconsin teachers based on the data available, the same forces driving changes in the teaching workforce can also affect the broader public sector.3 Proponents of Act 10 insisted that reducing collective bargaining rights for teachers would improve education by eliminating job protections such as tenure and seniority-based salary increases. As Gov. Scott Walker (R-WI) argued, “We no longer have seniority or tenure. That means we can hire and fire based on merit, we can pay based on performance. That means we can put the best and the brightest in our classrooms and we can pay them to be there.”4 However, the facts suggest that Act 10 has not had its promised positive impact on educational quality in the state.
The authors’ analysis using data collected by the Wisconsin Department of Public Instruction (DPI) finds that since the passage of Act 10, teachers have received far lower compensation; turnover rates have increased; and teacher experience has dropped significantly. Importantly, the harms from Act 10 extend beyond public-sector workers to all Wisconsinites, as current research suggests that student outcomes could be negatively affected by the law as well. Rather than encouraging the best and brightest students to become teachers and to remain in the field throughout their career, the law appears to have had the opposite effect by devaluing teaching and driving many teachers out of Wisconsin’s public schools.
Specifically, the analysis finds:
- In the year immediately following the law’s passage, median compensation for Wisconsin teachers decreased by 8.2 percent in inflation-adjusted terms, with median benefits being cut by 18.6 percent and the median salary falling by 2.6 percent.5 Median salaries and benefits continued to fall during the next four years so that median compensation in the 2015-16 school year was 12.6 percent—or $10,843 dollars—lower than it was before the passage of Act 10.
- The percentage of teachers who left the profession spiked to 10.5 percent after the 2010-11 school year, up from 6.4 percent in the year before Act 10 was implemented. Exit rates have remained higher than before, with 8.8 percent of teachers leaving after the 2015-16 school year— the most recent school year for which data are available.
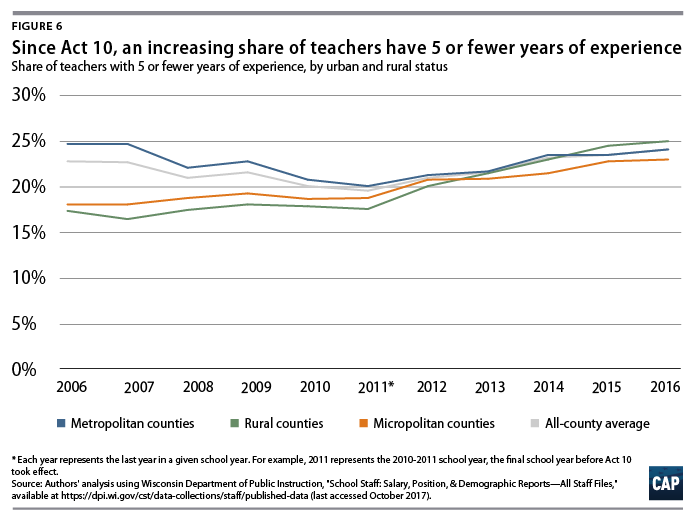
- The percentage of teachers with less than five years of experience increased from 19.6 percent in the 2010-11 school year to 24.1 percent in the 2015-16 school year.
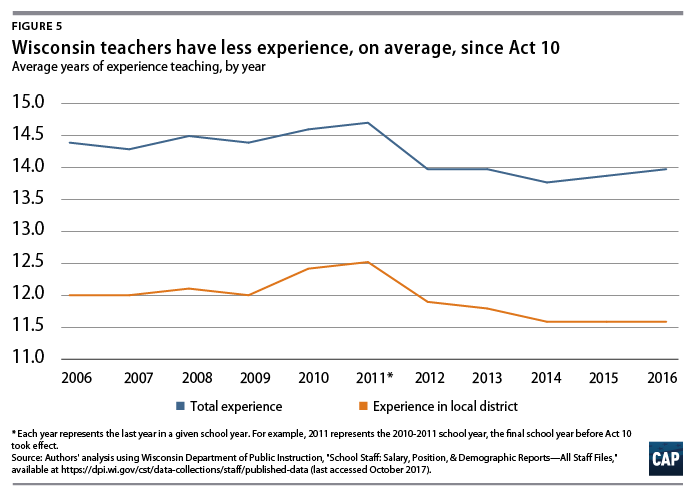
- Average teaching experience decreased from 14.6 years in the 2010-11 school year to 13.9 in the 2011-12 school year, which is where it remained in the 2015-16 school year.
- Interdistrict moves—when a teacher leaves one Wisconsin district to teach at another the next school year—has increased from 1.3 percent before the passage of Act 10 to 3.4 percent at the end of the 2014-15 school year.
These negative impacts are likely caused at least in part by Act 10 and associated budget cuts. Not only do the data show a clear change before and after Act 10 passed, but changes in compensation, turnover, and exit rates appear to be larger in Wisconsin than in other states.6 Further, both supporters and opponents of the law agree that it caused major cuts to teacher benefits and reduced teachers’ compensation. Research clearly illustrates how decreased compensation and less voice and influence on the job is connected to increased turnover.7
While many factors—including student demographics, parental involvement, teacher quality, and government policy—influence educational outcomes, research generally finds that students perform better when taught by more experienced teachers and that increased teacher turnover can harm student performance.8 High levels of turnover can also disrupt schools. As Elkhart Lake-Glenbeulah School District Administrator Ann Buechel Haack explained to the Milwaukee Journal Sentinel, “If you have excessive turnover of young staff, you are constantly in a building mode.”9
Peer-reviewed research on Act 10’s effects on student outcomes has yet to be published, but several academics have produced working papers examining the law’s impact on Wisconsin students. This research is consistent with the authors’ findings that Act 10 has led to reduced teacher experience, increased exit rates, increased interdistrict teacher transfers, and thus has likely reduced student outcomes. Indeed, a recent working paper by E. Jason Baron found that Act 10 had reduced statewide student achievement on science and math in large part because it caused many experienced teachers to leave the profession and facilitated the hiring of teachers away from more poorly performing schools to better-performing schools.10
Those concerned about the quality of public education—and of all public services—should understand that Wisconsin’s Act 10 and associated budget cuts have not had the positive impact on education that its proponents claimed it would. Instead, data show that Wisconsin’s teachers and students are likely faring worse since the law’s passage. Policymakers considering similar policies to restrict or eliminate the rights of public-sector workers should view Wisconsin as a cautionary tale. Such a law can harm both public servants and the public that they serve.
Background on Act 10
On March 11, 2011, Gov. Walker signed Wisconsin’s Act 10 into law. Act 10 reduced collective bargaining rights for most state and municipal employees, including K-12 teachers.11 The law also weakened unions by mandating annual recertification elections and prohibiting paycheck deductions for dues collection. It also eliminated teachers’ and other public employees’ rights to bargain over hours and conditions of employment, as well as their ability to bargain over any compensation beyond base pay. Act 10 further restricted this base-pay bargaining by limiting increases to annual inflation. The bill’s proponents argued that by eliminating requirements to bargain over salary structures, hiring, and working conditions, Act 10 would allow school districts to attract and retain higher-quality teachers.12 Furthermore, the bill cut benefits paid to public-sector workers, requiring public employees to pay half of the total contributions to their retirement plans after the expiration of any collective bargaining agreement. The bill also cut benefits by setting minimum employee contributions for health insurance purchased through the state health plan. 13
Gov. Walker argued that Act 10 was a budget repair bill. The bill was passed in the same year as Gov. Walker’s 2011 biennial budget bill, which made significant cuts to Wisconsin’s education budget. The final budget bill cut state K-12 spending by nearly $800 million, over7 percent—the largest amount in Wisconsin’s history—and limited local governments’ abilities to make up for these cuts through property taxes.14 That same year, Gov. Walker passed major tax cuts primarily targeted toward corporations and the wealthy that totaled $2.33 billion over 10 years.15 Gov. Walker and Act 10 proponents argued that the bill’s reforms would allow schools to offset these cuts by reducing teachers’ benefits and hiring lower-paid teachers, preventing budget cuts from affecting students.16 Gov. Walker also argued that eliminating requirements to bargain over salary structures, hiring, and working conditions would give schools additional flexibility needed to attract and retain higher-quality teachers.17
In short, the bill’s proponents argued that, in return for decreased state funding, giving school districts greater power over their workers would allow them to hire and retain high-quality teachers at a lower cost. The analysis in this report suggests that this theory was misguided.
Trickle-down economics have failed Wisconsin post-Act 10
Gov. Walker made several claims that his economic policies—including Act 10 and tax cuts favoring the wealthy and corporations—would lead to significant economic benefits for the rest of Wisconsin. These results have not panned out, just as previous experience with trickle-down economics would have predicted.18
Since the passage of Act 10 and associated tax cuts, Gov. Walker has continued to pass massive tax cuts. In 2017 alone, Gov. Walker’s tax cuts so far total $1.7 billion dollars and are highly focused on the richest Wisconsinites. According to analysis from the Wisconsin Budget Project, the top 1 percent of state residents receive a larger share of the cuts than the bottom 60 percent of households combined.19 These tax cuts certainly helped the rich—the wealthiest 1 percent of Wisconsinites received an average tax cut of $10,015.20 Gov. Walker has boasted that the state’s tax cuts will soon total more than $8 billion and that as a result, Wisconsin “continue[s] to see dramatic economic growth.”21 This dramatic growth, however, is nowhere to be found when examining Wisconsin’s job growth or household income growth.
Gov. Walker promised to create 250,000 private-sector jobs in Wisconsin during his first four years in office.22 Yet Wisconsin has not reached this marker even after 6 1/2 years. From January 2011 to June 2017, Wisconsin added 219,000 private-sector jobs at a growth rate of 9.4 percent.23 Over the same time period, private-sector employment in neighboring Minnesota grew by 12.2 percent and total U.S. private-sector employment grew by 14.2 percent. Had Wisconsin’s job growth matched Minnesota’s rate, it would have created an additional 65,000 jobs; had its growth matched the national rate, it would have added an additional 111,000 jobs.
The incomes of the typical Wisconsin household also have not grown as fast as their neighbors’ in Minnesota. While the median Wisconsin household saw a 6.8 percent increase in real income from 2010 to 2016, the median Minnesota household saw their incomes grow by 7.5 percent.24
Act 10’s potential impacts on teaching and other state services
State and municipal employees provide crucial services to Wisconsinites. These employees teach Wisconsin’s children; take care of elderly and disabled residents; provide safe roads and public transportation; protect the state’s natural resources; and help residents recover from illness, among other roles. Budget cuts and attacks on union rights can harm the pay and working conditions of these employees. As a result, it can become more difficult to attract and retain high-quality employees, reducing the quality of service received by Wisconsin residents.
Compensation and working conditions can affect employee turnover
When the quality of public jobs is lowered, it becomes more difficult for state and local governments to hire and keep high-quality and experienced employees. Research indicates that today’s public-sector workers such as teachers receive less compensation—or combined pay and benefits—than similar workers in the private sector.25 Historically, public-sector jobs were attractive to workers due to their stability, their high-quality benefits such as defined-benefit pensions, as well as their intangible benefits such as pride in public service. Further reductions in compensation could lead more workers to decide that they can no longer sacrifice higher pay in the private sector in order to serve the public.
Research indicates that both the level of compensation and degree of workers’ input on the job, which is increased through union membership, affect voluntary turnover. A cross-sectional analysis of state government employees from Sally Coleman Selden and Donald P. Moynihan found that states with higher pay for state employees experience lower turnover.26 This reduction in turnover from increased compensation helps to explain the common finding that employees’ productivity can increase when they are paid higher wages.27 Furthermore, Selden and Moynihan found that states with a higher percentage of state employees covered by collective bargaining agreements have lower voluntary turnover, even after taking into account the effect of unionization on pay increases.28
Unions can also affect involuntary turnover, since collective bargaining agreements generally include just cause provisions that set standards for employee termination. This type of turnover is less relevant for this analysis of changes in the teaching workforce, since most teacher turnover is voluntary. Nationally, only 10 percent of teachers who left the profession after the 2012-13 school year left involuntarily.29 But while there is a common view that unions hinder school districts’ ability to fire poorly performing teachers, a working paper from Eunice S. Han, an economist at the University of Utah, found the opposite. Han examined national teacher turnover data and found that while school districts with strong unions have lower overall turnover, they also dismiss more underperforming teachers. Since districts with stronger unions tend to pay teachers higher salaries, districts have greater incentives to dismiss underperforming teachers before they achieve tenure.
Declining teacher experience and increasing turnover can harm students
These changes in the public-sector workforce can have a real effect on the broader public, as research on the impact of teachers on educational outcomes shows. To be sure, a variety of societal and individual factors—such as the income level of a student’s family—also affect educational outcomes.30 But when controlling for these factors, teacher quality makes a significant difference for students’ test scores and other educational outcomes. Teacher quality is affected by a variety of attributes. Research has found that teachers’ qualifications, academic preparation, and high performance on standardized tests can have a positive effect on teacher quality.31 Teachers’ experience levels can also have a large impact on student success.
Longitudinal data systems allow comparisons of individual students’ test scores from year to year, allowing researchers to control for the unique characteristics of individual students. The systems also track the teacher to which each student is assigned. By tracking students over time, these systems allow researchers to examine how being in a given teacher’s class changes each student’s test scores from year to year. This is referred to as a teacher’s value-added measure.
When measuring teacher effectiveness in this fashion, researchers are able to implicitly control for teachers’ fixed effects—or attributes that are assumed to not change over time—such as the quality of teacher preparation that the teacher received. After controlling for this initial measure, studies using these systems can examine how a given teacher’s value-added measure changes over time.
In a report for the Learning Policy Institute, education researchers Tara Kini and Anne Podolsky reviewed 30 recent studies on how teacher experience increases teacher effectiveness.32 They found that the literature generally shows that a teacher’s level of experience is positively correlated with student performance on standardized tests. The majority of the studies that they reviewed controlled for teachers’ fixed effects, and all of these studies found this positive association. While some earlier findings on teacher effectiveness showed that the impact of teaching experience on student learning disappeared after the first few years of teaching, Kini and Podolsky find the majority of more recent studies reviewed using longitudinal analysis found that while teachers do improve more quickly in their initial years of teaching, their effectiveness continues to grow in the middle and late stages of their career.
Increased teacher experience has been shown to affect student outcomes in a significant, measurable way. For example, a study by Helen Ladd and Lucy Sorensen of North Carolina middle school students found that a teacher with midlevel experience of 12 years raised English test scores by .08 standard deviations and math test scores by .18 standard deviations more than a new teacher.33
The positive impacts of having an experienced teacher extend beyond better test scores for students. Ladd and Sorensen’s study also found that experienced teachers dramatically reduced student absenteeism and motivated students to read more for pleasure and behave better in class.34
There is also evidence that it is not only teachers’ overall experience that improves student outcomes, but also that consistency and continuity in teachers’ experience at a particular school matters. The importance of local experience—the amount of time a teacher works at a specific school or grade level within a school— makes sense, as over time, a teacher can become more comfortable with the curriculum of a given grade or the practices of a specific school.
A study using data from New York City public schools found that increased turnover on a school’s team of teachers for a certain grade level is associated with poorer student performance. For example, a change of one standard deviation in turnover on a given grade-level team is associated with a drop in student math scores of .02 standard deviations, while 100 percent turnover on a given grade-level team is associated with a drop in student math scores of between .08 and .10 standard deviations.35 These effects extend beyond students with a new teacher, indicating that increased turnover causes disruption that can affect other classrooms. The study found that these effects were “especially deleterious in lower-achieving schools.”36
Analysis of Wisconsin teacher data
To examine the impact of Act 10 on Wisconsin’s teacher workforce, the authors use 10 years of data from the DPI’s all-staff files, spanning from the 2005-06 school year to the 2015-16 school year.37 This administrative data set includes information on staff demographics, compensation—including both salaries and benefits—and experience. Starting with the 2008-09 school year, each teacher was assigned a file number that was maintained throughout their career. As such, this analysis of staff turnover—including both interdistrict transfers and those leaving the profession entirely—is only presented from the 2008-09 school year onward.
While the all-staff file includes data on all staff members, including administrators and support staff, this analysis is limited to teachers in public school districts, excluding long-term substitutes.38 The all-staff file also includes entries for multiple assignments in a given year for some teachers. In these instances, teachers have been assigned to the school and assignment at which they spent the majority of their time.
In order to determine if Act 10 affected urban areas of Wisconsin differently than rural areas, the authors’ analysis classifies counties using the 2013 National Center for Health Statistics (NCHS) Urban-Rural Classification Scheme for Counties.39 (see Appendix 1) The NCHS’s four metropolitan classification levels, which include counties within metropolitan statistical areas as defined by the Office of Management and Budget, are combined in this analysis. Micropolitan counties are defined as those within micropolitan areas, which have urban clusters with a population of at least 10,000 but less than 50,000.40 The NCHS defines counties that are in neither a metropolitan nor a micropolitan area as noncore counties, which this analysis labels as rural.41
Teacher compensation has declined
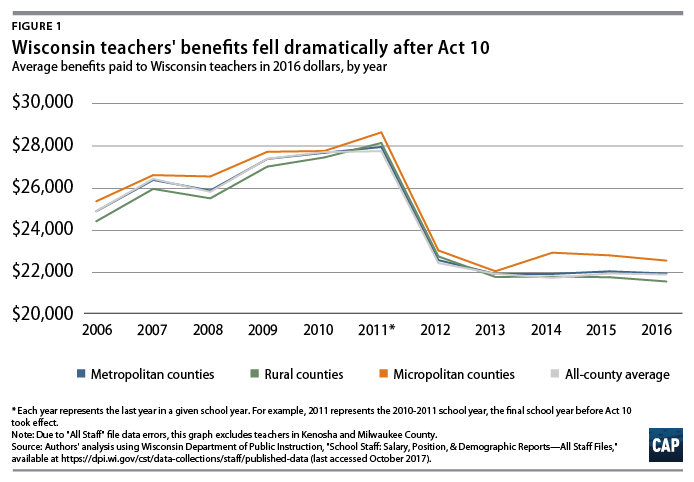
Analysis of Wisconsin administrative data shows that after the passage of Act 10, teachers’ average compensation fell dramatically. This was primarily driven by a decrease in fringe benefit compensation dictated by two provisions in Act 10. Prior to Act 10, employees could negotiate with their employers to contribute some or all of any statute-mandated employee share of retirement benefits.42 The bill eliminated that option, forcing employees to pay half of retirement plan contributions—which totaled 5.8 percent of teachers’ salary for the 2011-12 school year—once collective bargaining agreements expired.43 Act 10 also set minimum employee contributions for state health plan enrollment, while in the past, teachers could negotiate for their employers to cover a greater share of costs, potentially in exchange for smaller salary increases.44
In the aftermath of these changes, the average benefits paid to Wisconsin teachers dropped by nearly 19 percent from the 2010-11 school year to the 2011-12 school year. The average amount of benefits paid per Wisconsin teacher has continued to drop in real, inflation-adjusted terms in subsequent years, as shown in Figure 1.
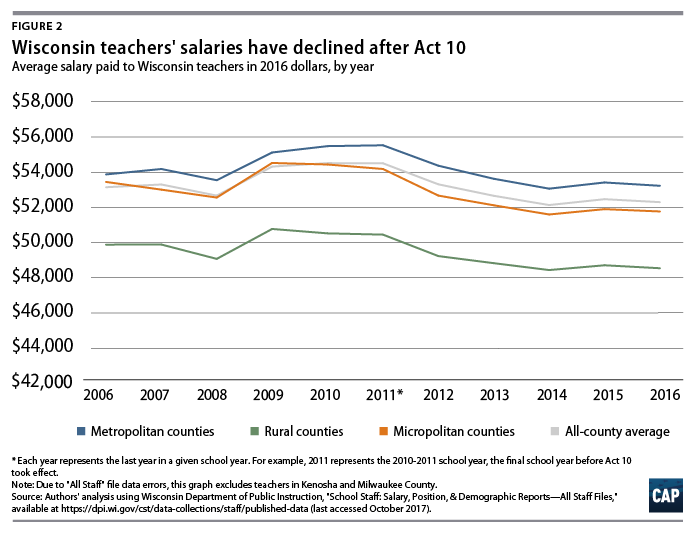
Teacher salaries also fell after Act 10 was passed. Average teacher salaries fell by $1,268 in real terms from the 2010-11 school year to 2011-12 school year. Year-over-year pay cuts were found across urban and rural counties and ranged from 2 percent in metropolitan counties, 3.4 percent in micropolitan counties, and 3 percent in rural counties. On average, inflation-adjusted salaries continued to fall in the years after Act 10 took effect, and remain well below 2011 levels.
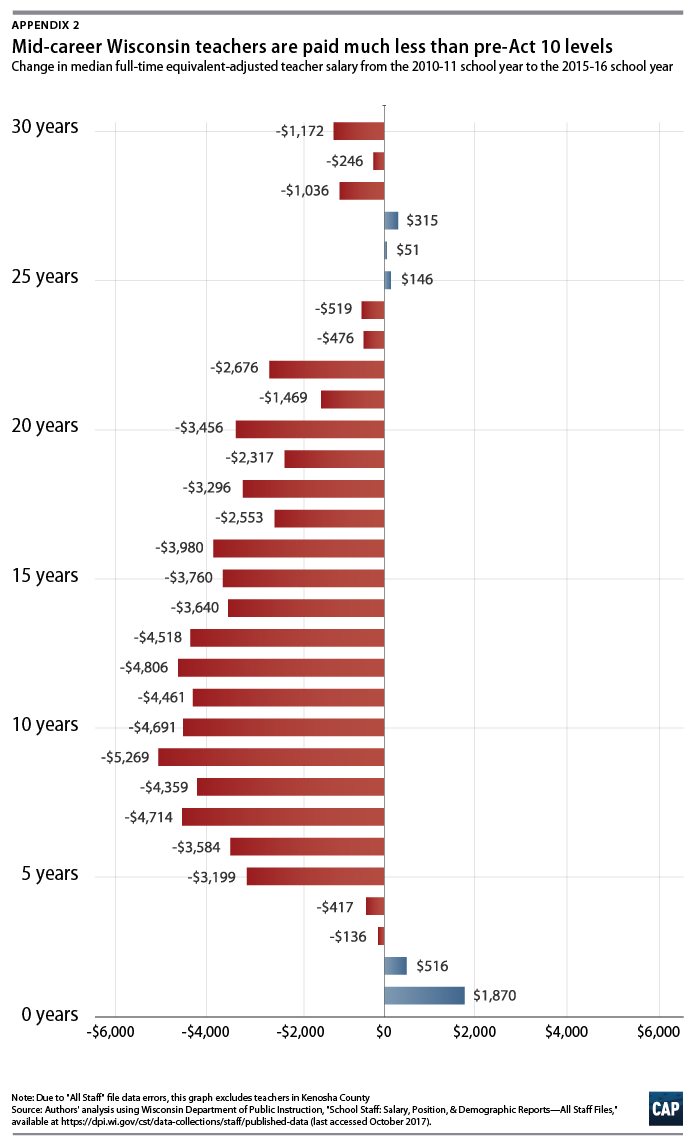
Declining teacher salaries were partially driven by compositional effects, as the teacher workforce became more junior due to increased retirements among older workers. However, salaries have also fallen on average for teachers at a given experience level. This analysis—included as Appendix 2—finds that the full time equivalent annual salary for a typical teacher at a given year of experience fell by $2,262 from the 2010-11 school year to the 2015-16 school year.45 Teachers in their first two years of experience have actually seen slight increases in real salaries as school districts attempt to fill open positions. But over time, teachers in their midcareers have seen major salary reductions in the aftermath of Act 10, with teachers who have between five and 15 years of experience seeing their annual salaries fall by an average of $4,273.
Since Act 10 was passed in the same year as statewide budget cuts, it is possible that some of these changes were driven by cuts in funding to education. However, a working paper from Andrew Litten, a doctoral candidate at the University of Michigan, examines which has the larger effect by taking into account the timing of collective bargaining agreement expiration and differing sizes of cuts to state funding by district.46 His findings suggest that the reduction in teacher compensation was primarily a result of Act 10’s collective bargaining reforms, not the cuts to state education aid. The impact on teacher compensation was generally the same across districts, regardless of the degree to which state funding cuts affected that district.
Falling compensation will likely make it more difficult for schools to attract high-quality teachers and increase the likelihood that teachers will either leave the field to pursue private-sector jobs or move to teach in other states. Teachers are generally paid less than other college-educated workers. Research from the Economic Policy Institute shows that teachers’ salaries were 17 percent lower than what comparable workers in other fields earned nationally in 2015.47 When benefits were included, teachers still earned 11 percent less than comparable workers.48 The data below suggest that declining compensation has likely contributed to that predicted effect.
Turnover has increased
Wisconsin’s 2011 budget cuts and the passage of Act 10 could have affected the turnover of teachers and other public servants in multiple ways, some of which would have conflicting effects. Budget cuts would increase the likelihood of involuntary turnover, with schools and local governments forced to lay off employees. Eliminating public employees’ bargaining rights and cutting benefits would lower employee compensation, which Act 10 proponents argued would alleviate budget pressures and reduce layoffs. Lower compensation and new restrictions on unions could also encourage increased voluntary turnover, with private-sector employment or retirement becoming relatively more preferable for teachers and public servants.
Previous research from Eunice Han examined the immediate impact on turnover in four states, including Wisconsin, which restricted teachers’ collective bargaining rights during the 2010-11 school year.49 Han found that in these states, involuntary dismissals were lower relative to the nation as a whole, but that more teachers voluntarily left the classroom. As a result, the likelihood that teachers were classified as highly qualified fell in states that restricted bargaining rights. While the DPI all-staff files do not allow for the distinction between voluntary and involuntary turnover, they do provide a longer post-Act 10 time span to examine its impact.
More teachers have left the classroom
As discussed above, teacher turnover can have a negative effect on students’ academic performance. Unfortunately, the passage of Act 10 coincides with a major increase in teachers leaving the profession altogether.
This analysis shows that the percentage of teachers who left the profession after the 2010-11 school year dramatically increased from the share who left after the 2009-10 school year.50 This is unsurprising considering news reports from the aftermath of Act 10, which described many older teachers choosing to retire in order to secure their current retirement benefits.51 The authors’ analysis shows that the immediate uptick in teachers leaving the workforce after the 2010-11 school year was almost entirely driven by teachers over the age of 55, the minimum retirement age with reduced benefits under the Wisconsin Retirement System.52
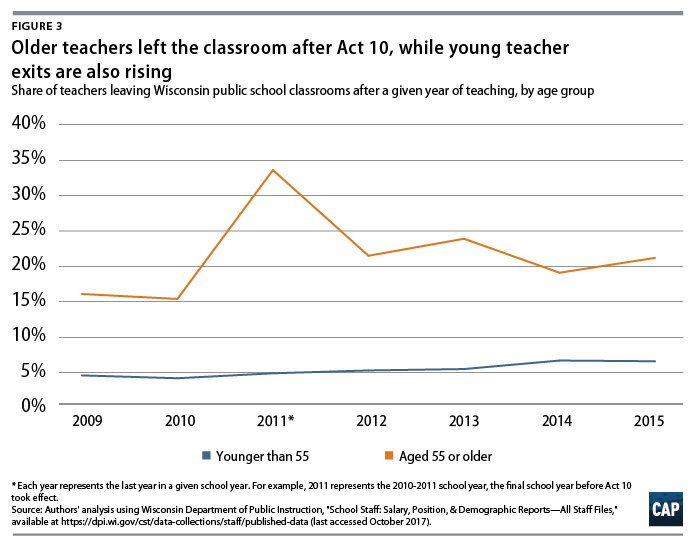
While the exit rate of those under the age of 55 did not spike directly after the passage of Act 10, it has begun to rise in recent years. After the 2008-09 and 2009-10 school years, an average of 4.4 percent of teachers under 55 left the classroom after a given year. After the 2013-14 school year, this exit rate rose to 6.7 percent, and remained elevated at 6.6 percent after the 2014-15 school year. Additional analysis shows that the exit rates of midcareer teachers rose more quickly than the exit rates of the most junior teachers. It is possible that this is a delayed result from Act 10 as school districts began to use their new rights to change working conditions without bargaining. Further study could determine if this decrease in teacher retention is related to district-level contract expirations. With an increasing share of teachers leaving the classroom, schools face the challenge of filling more vacancies—the difficulty of which is compounded by national trends of lower enrollment in teacher preparation programs.53
Media reports show that this phenomenon may not be limited to teachers, as Wisconsin has also seen increased turnover among state government employees. In 2016, twice as many state workers outside of the state university system left their job than they did in 2010.54
More teachers have transferred districts
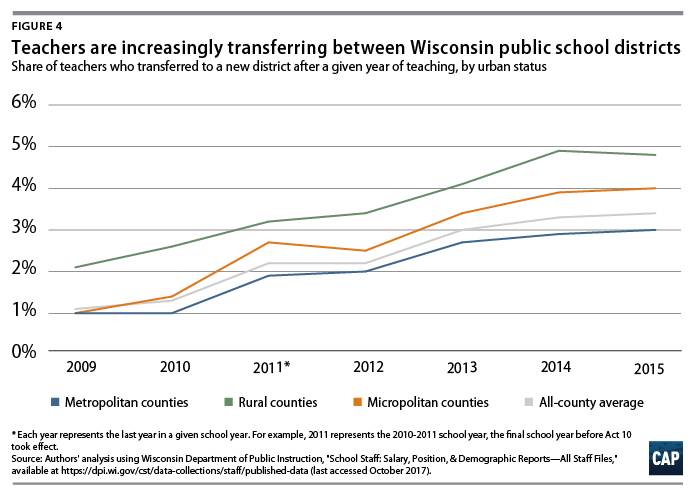
The data show that the number of teachers moving between school districts has risen in the aftermath of Act 10. There was no dramatic spike after the 2010-11 school year, however, which is reasonable when considering that school districts have gradually moved to new salary structures.
While 1.2 percent of teachers on average left to work at another district after the 2008-09 and 2009-10 school years, this share has risen over time since the passage of Act 10. For example, after the 2014-15 school year, 3.4 percent of teachers moved to another district. This is not a phenomenon limited to metropolitan areas. In fact, teachers in rural counties are most likely to transfer to a different Wisconsin public school district.
These data confirm what Wisconsin superintendents have described to the media. As the superintendent of a small rural district explained, “Some districts are headhunters and have the authority to pay what they want.”55 Others complained that their district was being used as a “feeder system” or “farm team” for other districts.56
This turnover can put a strain on school systems. Recruiting new teachers is expensive. University of Wisconsin-Madison professor Peter Goff estimates that Wisconsin schools spend between $4,000 and $9,000 to hire a teacher.57 And increased vacancies mean that districts may have to lower their standards in order to fill teaching slots. This constant turnover can have a negative effect on student learning. As discussed previously, teachers tend to be more effective when teaching in the same district, grade, and classroom for consecutive years. Students in school districts experiencing increased turnover may lose out.
Teacher experience has fallen
Our analysis finds that in Wisconsin, the average amount of teacher experience—both the overall years of teaching in Wisconsin and years of teaching in a specific school district—has fallen in recent years, with a large drop in experience coinciding with the passage of Act 10. Considering the dramatic increase in retirements and interdistrict transfers resulting from Act 10, this is not surprising. Additionally, analysis from the Public Policy Forum shows that in recent years, teachers entering the workforce have had fewer years of experience than those who entered the workforce before Act 10.58
This analysis shows that the average Wisconsin teacher in the 2015-16 school year had 13.9 years of total experience and 11.6 years of experience in their current school district. This is below the peak total experience of 14.6 years and district experience of 12.5 years in the 2010-11 school year.
During the school year of Act 10’s passage, 19.6 percent of Wisconsin teachers had five or fewer years of experience, and 7.6 percent had two or fewer years of experience. This has risen in recent years. In the 2015-16 school year, 24.1 percent of teachers had taught for five years or fewer, and 10.3 percent were in their first two years of teaching. Rural districts have seen their share of low-experience teachers grow most dramatically, from 17.6 percent of teachers in the 2010-11 school year to 25 percent in the 2015-16 school year.
Existing research shows how Act 10 has affected student test scores
Educational outcomes are shaped by many factors, but research shows that teacher quality is the most important in-school factor influencing student achievement.59 Of course, other out-of-school factors, which are often caused by poverty, can also influence student outcomes.60 Because teacher quality has been shown to have a measurable impact on standardized test scores, some academics have started trying to directly measure the impact of Act 10 on student outcomes by examining how students fared on standardized tests after its passage.
Academic researchers have used the implementation of Act 10 to measure impacts from different policy interventions. Results must be interpreted cautiously, as the literature remains relatively limited and has yet to be published in peer-reviewed journals. Preliminary research focusing on the statewide impact of Act 10 finds that test scores in aggregate have fallen as a result of policy changes from the law, particularly among schools that already lagged behind on test scores. Other research looks specifically at the impact of new types of pay structures that some districts have implemented in the aftermath of Act 10. These findings suggest that the outcomes of the typically wealthy and high-performing districts who moved to individual-based pay systems61 saw improvement compared with districts that continued to pay teachers through salary schedules.
In a 2017 working paper, Florida State University doctoral student E. Jason Baron examines the impact of Act 10 on student performance across the state of Wisconsin.62 Act 10 provisions that limited collective bargaining were only implemented once current collective bargaining agreements expired. Therefore, Baron uses the length of pre-Act 10 district collective bargaining agreements to specifically target the effect of the law. Districts with contracts that were negotiated before Act 10 was announced and that expired after the 2011-12 school year serve as a control group for the effect of Act 10. These districts are compared with districts that were immediately affected by Act 10’s restrictions on collective bargaining.
Baron finds that Act 10 resulted in a decline in average high school test scores in math and science by .15 to .18 standard deviations. Baron notes that the magnitude of the decline in student performance is nearly the same magnitude of the increase in test scores that studies have found come from a reduction in class size of eight students. Importantly, he finds that the decline in student performance is entirely driven by test scores falling further behind at schools that are already in the lowest half of the distribution of test scores. At these low-performing schools, test scores fell by an average of .3 standard deviations after Act 10’s implementation, with a larger effect in the second year after the law’s implementation than in the first. High-performing schools had no significant increase in test scores.
A 2017 working paper from Barbara Biasi, a postdoctoral fellow at Princeton University, suggests a more positive impact of one specific policy change made possible by Act 10, that is, allowing school systems to more easily implement new pay structures. It does not attempt to show the net impact of Act 10 across all Wisconsin students.63
Teacher pay is often determined by a standard salary schedule, meaning that pay is based on a teacher’s years of experience and education level.64 Before the passage of Act 10, teachers would negotiate the details of this salary schedule with their school system through their union. Due to Act 10’s collective bargaining restrictions, school districts are no longer required to negotiate over pay structures, which allows them to pay teachers on an individual basis rather than on a fixed schedule. Biasi’s working paper focused on how the quality of newly hired and exiting teachers varied in districts that moved to new individual-salary structures compared with districts that remained on set salary schedules.
A Wall Street Journal editorial described the study as finding that “better teachers gravitate to districts where they can negotiate their own pay while lousy teachers tend to migrate toward those where salary scales are regimented.”65 The WSJ editorial board frames the study as showing that “student math achievement rose significantly in individual-salary districts relative to salary-schedule districts due in part to improvements in the teacher workforce.”
The actual magnitude of these changes in test scores, however, is not statistically significant at conventional levels and is relatively small compared with Baron’s findings. Biasi found that math scores rose by .063 standard deviations in individual-salary districts compared with salary-schedule districts, and this finding is only statistically significant at the 10 percent level. Furthermore, teacher composition only explains a small share of the change in math test scores—.008 standard deviations—between district types.
According to Baron’s analysis of Biasi’s findings, the limited positive impact of individual pay schedules in some districts appears to come at the expense of overall student performance, with wealthier districts hiring experienced teachers away from poorer districts. Baron examined the type of schools that switched to individual-salary schedules and found that before Act 10, these schools were in districts with higher test scores, more property tax revenue, and higher teacher salaries. He also found that the negative impact of Act 10 was “entirely concentrated in schools that kept salary-schedule regimes” and that there is “no evidence that Act 10 as a whole affected student achievement in performance-pay schools.” Baron interpreted these results to mean that that individual-salary schools were able to use poaching—hiring high quality teachers away from lower-performing school districts—to counteract potential performance declines from increased retirements after Act 10.66
Moreover, even the small gains that Biasi found in certain districts may decline if more local districts implement individual-based pay structures and if there are fewer salary-schedule districts from which to hire teachers away. Biasi acknowledges this point, noting that, “if in the future all districts move towards merit pay … the longer-term effects of Act 10 in each district and in the whole state might be more limited in size.”67
A working paper from Jonathan Roth, a doctoral student at Harvard University, examines the impact of the rise in teacher retirements immediately following the passage of Act 10.68 He finds that in the 2011-12 school year, teacher value-added measures in math improved among school-grade levels in elementary schools in which a larger fraction of teachers retired. He notes that this is not driven entirely by the difference in teacher quality between retirees and their replacements, as he also finds evidence that other grades see an increase in student test scores when a larger share of teachers in another grade retired. Roth suggests that increased retirements could have freed up resources that schools could then use in other ways, as retiring teachers were paid more than their younger replacements. The effect on value-added measures on other grade levels was not found after retirements before 2011, which may suggest that the reallocation of resources was more important after 2011’s school budget cuts. This study suggests that the immediate surge in retirements may have not negatively affected student performance but does not address the impact of increased turnover among teachers of any age and experience level after Act 10.
In short, academic research is consistent with the authors’ findings that Act 10 led to a reduction in teacher experience and greater interdistrict transfers. While specific studies on the impact of changing salary schedules and increased retirements after Act 10 show small benefits to test scores in specific grades and districts, a study examining the overall impact of Act 10 has found broad, negative effects on Wisconsin high school student achievement. Consistent with predictions based on previous research, it appears that the reductions in experience and increases in turnover after Act 10 in aggregate have reduced student outcomes.
Challenges attracting high-quality teachers may continue
There are additional indicators that Wisconsin will face continued challenges in attracting a high-quality teaching workforce in a post-Act 10 environment. A state survey of school districts found that in the 2015-16 school year, many Wisconsin districts with vacancies faced an “extreme shortage” of applicants.69 Among major subjects, when districts had vacancies to fill, extreme shortages were particularly prevalent for positions teaching math, at 54 percent, and science, at 50 percent. Extreme shortages were even greater in specialized areas. For example, 89 percent of school districts with teacher vacancies in technology and engineering reported having extreme shortages, and 85 percent of districts with vacancies in agriculture reported the same.70 Members of a group of administrators, principals, and teachers convened by the Wisconsin state school superintendent on staffing issues reported fewer applications across the board, with rural members reporting “few to no applications for many disciplines.”71 Analysis by the Public Policy Forum of U.S. Department of Education reports finds that enrollment in Wisconsin teacher preparatory programs has fallen by 28 percent since 2008, while some neighboring states have seen even greater declines.72 It is worth noting that this problem is not limited to Wisconsin—teacher preparatory programs have seen falling enrollment in many states.73
Wisconsin has also become increasingly reliant on emergency licenses and permits in order to fill its classroom positions. Reports indicate that part of this increase is related to potential teachers being unable to pass a new state test, known as the Foundations of Reading Test.74 As a result of staffing issues, the Wisconsin DPI has issued an emergency rule easing licensing requirements and is pursuing a rule that would further ease the licensing process and eliminate state GPA and Praxis test score requirements for teacher prep programs.75 This increase in teachers with alternative forms of certification may lead to future problems with teacher retention. An analysis by the Learning Policy Institute of National Center for Education Statistics data from the School and Staffing Survey found that full-time, alternatively certified teachers are 25 percent more likely to leave the classroom than similar teachers with standard certifications at similar schools.76
Conclusion
When Gov. Walker and the Wisconsin Legislature passed Act 10 into law, they argued that reducing teachers’ compensation and influence at their schools would benefit the state and local school districts while protecting students from the harms posed by accompanying budget cuts. Evidence from recent years suggests that this is not the case and that the decision to pass Act 10 may have hurt not only teachers and other public servants, but Wisconsin’s students as well.
Other states should heed the warning of Wisconsin’s example. Lawmakers should strive to modernize and elevate the teaching profession instead of tearing it down. By supporting teachers, states can ensure that classrooms are filled with the best instructors, benefiting students and the state as a whole. More broadly, states should consider the impact that efforts such as Act 10 would have on all public-sector workers and the services that they provide.
David Madland is a senior fellow and the senior adviser to the American Worker Project at the Center for American Progress. Alex Rowell is a research associate for Economic Policy at the Center.

Endnotes