See also: Explore the report and data on the interactive: www.healthofstatedemocracies.org
In the United States, certain rights and privileges of citizenship are protected both by the Constitution and under federal law. In practice, however, state laws are critical in determining the health of the democratic process and the ability of citizens to make their votes count in particular states. Most decisions are made at the state level—by legislation, administrative procedures, or judicial rulings—and the results determine the extent to which citizens experience the robust benefits of a democratic society.
What is a healthy democracy? In the most general sense, democracy means rule by the people. In his book On Democracy, Robert Dahl—one of America’s foremost democratic theorists—lays out what he considers to be the five crucial criteria by which to evaluate a democratic system. These are:
- Effective participation
- Voting equality
- Enlightened understanding
- Control of the agenda
- Inclusion of adults
A number of other observers from academia to nongovernmental organizations have offered their own definitions and measures. While this report does not attempt to catalogue them all, it is worthwhile to point out a few approaches in order to contextualize the one used here.
At the global level, Freedom House publishes “Freedom in the World,” an annual report and a comparative assessment of political rights and civil liberties worldwide. The organization looks at the rights and freedoms that individuals have in democracies, rather than the performance of a country’s government, in considering how democratic, or free, a country’s people are. The Economist Intelligence Unit produces the “Democracy Index” to evaluate democracy on five primary parameters: electoral process and pluralism; civil liberties; the functioning of government; political participation; and political culture.
At the national level, Yale Law Professor Heather Gerken’s influential “The Democracy Index: Why our Election System Is Failing and How to Fix It” focuses on the mechanics of democracy, such as figuring out how many people cast ballots in a given election or how long people wait in line to vote. It goes into great detail to identify how to solve problems in election administration and has informed other policy-focused work, such as the Pew Charitable Trust’s Elections Performance Index. Further, the Center for Public Integrity’s “State Integrity Investigation” includes a detailed report card on each state’s corruption risk.
This report aims to take a broader approach to evaluate state-level democratic performance. It evaluates measures such as voting laws, redistricting, campaign finance, fair courts, and more as vital, interconnected pieces of a state democracy. While these topics usually have been analyzed in their own discrete silos, this report examines each state’s performance across measures in order to better examine the diverse criteria necessary for a successful democratic system.
It is impossible, of course, to include and evaluate every factor that may support or detract from a strong state democracy. However, the metrics included in this report were selected specifically to provide meaningful insights into the health of a state’s democracy and, for as many factors as possible, to supply clear policy prescriptions.
This report focuses on 22 individual factors, delineating them into three categories. The Methodology section goes into more detail about how these factors were chosen and constructed and how states were scored. The categories and factors are as follows.
Accessibility of the ballot
- Availability of preregistration
- Availability of online voter registration
- Availability of portable voter registration
- Availability of in-person early voting
- Availability of no-fault absentee voting
- Voter ID laws
- Voting wait time, 2008 and 2012
- Provisional balloting rate, 2008 and 2012
- Participation in the Interstate Crosscheck system
- Motor Voter implementation performance
Representation in state government
- Felony disenfranchisement laws
- Ballot initiative laws
- District distortion
- Female elected representation
- Communities of color elected representation
Influence in the political system
- Campaign contribution limits for individual donors
- Availability of public campaign financing
- Campaign disclosure laws
- Revolving door bans
- Open legislative data
- Judicial recusal laws
This report evaluates all 50 states and the District of Columbia along each of these factors, assigning points based on a state’s performance. After combining all the factors, it arrives at ranks and grades within each category, which are then used to calculate an overall rank for each state.
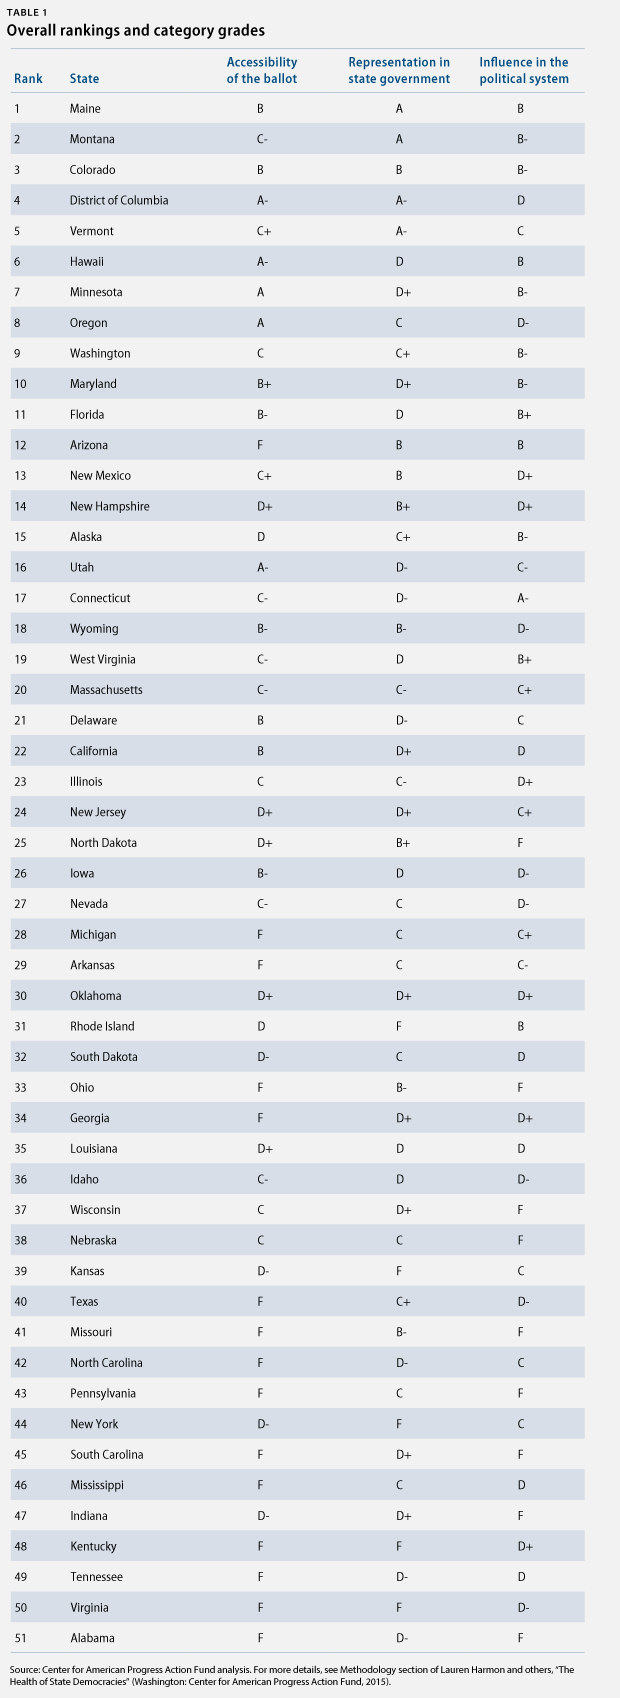
Based on this analysis, the state with the healthiest democracy is Maine, while the state with the weakest democracy is Alabama.
Figure 1 lists the states in ranked order and includes an assigned grade for accessibility of the ballot, representation in state government, and influence in the political system.
Taking a closer look at states’ rankings and grades, and putting them in the context of our nation’s political and electoral environment, the authors made the following six findings.
- States offer vastly different democratic experiences to their residents. Depending on the state in which someone lives, a citizen can have vastly different experiences with respect to voting, representation, and accountability. In one state, a citizen may be able to vote three weekends before Election Day; in another, she may be forced to wait in a long line on Election Day to cast a ballot. In one state, a citizen may have elected officials who are nearly representative of the state’s demographic makeup; in another, some groups may be woefully underrepresented. One citizen may live in a state where elected officials are beholden to big money, while in the state next door, policymakers could be trying to counteract its influence.
- Even within states, there can be volatility from one category to another. Given the diverse set of issues covered in this report, states rarely excel across all three categories of the evaluation. Twelve states got at least an A or B in one category while receiving a D or lower in another. Oregon, for example, got an A in accessibility of the ballot but a D- in influence in the political process.
- Every state has room for improvement. From the highest-ranked states to the lowest, each state can take concrete steps to improve its residents’ democratic experience. Maine, the top-ranked state on the list, still scored poorly on factors such as Motor Voter implementation and online voter registration. Alabama, in the bottom slot, performs well in certain aspects, including having a two-year revolving door ban.
- States that rank better on accessibility of the ballot have significantly higher voter turnout. Average voter turnout in the 2012 election among the top 10 states for accessibility was 62.3 percent. Among the bottom 10 states in that category, turnout was nearly 4 percentage points lower, at 58.5 percent. Correlation does not equal causation, but this result is worth noting for state officials seeking to increase citizen engagement.
- States previously covered by Voting Rights Act preclearance requirements performed poorly in accessibility of the ballot. Following the ruling in Shelby County v. Holder, states previously covered by preclearance requirements under the Voting Rights Act were no longer required to receive prior approval for changes to their voting laws. This includes nine states covered in total, as well as an additional six states in which only particular counties or townships were previously subject to preclearance. While several of these states may perform well in other categories, each of the nine states that were covered in total by preclearance requirements performs poorly in accessibility of the ballot: They are ranked in the bottom half of all states in that section, and none gets a grade higher than a D+.
- States have a lot of room for improvement to ensure that elected leaders reflect state demographics as a whole. There is no state in which women are overrepresented in elective office and only two—Vermont and Mississippi—in which people of color are represented in the state’s elective offices at or above their share of the population at large. And doing well in one measure is no guarantee of doing well in the other: Oklahoma, which ranks first in female elected representation, ranks last in communities of color elected representation.
- The strength of laws related to influence in the political system are a particularly weak spot for states. Just one state received an A- grade in this category, fewer than any other category. Four states got an A or A- in representation, and five got an A or A- in accessibility.
- While the District of Columbia ranks high overall, its democratic health is extremely weak. This report includes the District of Columbia and compares components of its democracy to that of the 50 states. Based on the factors that are possible to measure, the District of Columbia ranks fourth overall. The relatively strong performance is largely a product of local measures implemented by the District’s mayors and city councilmembers over the years. Of course, thinking more broadly, the quality of the District’s democracy is deeply undermined by its lack of voting representation in Congress or local budget control. Washington’s citizens—like all citizens—are required to pay federal taxes, serve on federal juries, and fight in national wars, yet a Congress comprised of members elected from other states has final authority over its budget and laws. Congress also has the ability to override the outcomes of the relatively high functioning democratic process the District has set up to try to govern itself.
Ultimately, this report aims to magnify where states do well and where they can improve. The following sections walk through each of the three categories, describing the factors that make up each, why they have been included, and how states perform in them. The report then offers policy recommendations based on each category and the factors within it. These include modernizing voter registration, eliminating barriers to participation and representation, and exposing and limiting the influence of big money in the political system.
Lauren Harmon is the Associate Director for Voting and Democracy Campaigns at the Center for American Progress Action Fund. Charles Posner is the Policy Manager at the Center for American Progress Action Fund. Michele L. Jawando is the Vice President for Legal Progress at the Center for American Progress Action Fund. Matt Dhaiti was a Research Associate for the ThinkProgress War Room at the Center for American Progress Action Fund.