In the aftermath of the 2016 election, many have attributed President Donald Trump’s electoral victory to the anger of the working class, calling for progressives to dedicate themselves to winning back these voters.1 Often, whether implicitly or explicitly, these calls have been focused on a certain subset of the working class.2 For some, including President Trump during his campaign, “working class” has effectively become shorthand for white male workers in the goods-producing industries of manufacturing, construction, and mining.3
But in reality, the U.S. working class—defined for this analysis as participants in the labor force4 with less than a four-year college degree—is more diverse than ever and growing more so.5 Since 1960, the industrial work that has often been discussed by policymakers on the campaign trail has been shrinking as a share of working-class employment; in fact, it has never made up the majority of U.S. working-class jobs.6 As a result of these trends, white male workers in industrial sectors now comprise just 11 percent of the broad working-class labor force.7
Working-class workers make up a large share of the U.S. population. The latest available data from the U.S. Census Bureau’s American Community Survey show that 43 percent of American adults, or 107 million people, are in the labor force and have less than a bachelor’s degree.8 Of these workers:
- A large share of the working class is employed in the service sector. In 2015, 76 percent of noncollege workers worked in the service sector. Comparatively, just 21 percent of today’s working class works in the industrial sectors of manufacturing, construction, and mining. In 1960, the share of the working class in industrial employment peaked at 37 percent, and its decline accelerated after 1980.9
- The non-Hispanic white share of the working class is declining rapidly. According to the latest data, non-Hispanic white people make up 64 percent of the overall adult population but just 59 percent of the working class, whereas 75 years ago, those percentages were nearly equal. African American workers make up 14 percent of today’s working class, and Hispanic workers make up 21 percent. The non-Hispanic white share of the working class began to fall dramatically after 1970, when it stood at 85 percent.10
- Women now make up nearly half of the working class. In 2015, 46 percent of working-class workers were women, compared with 33 percent in 1960. However, this share has been flatlining since about 1990, as female labor force participation growth has slowed and educational attainment has increased.11
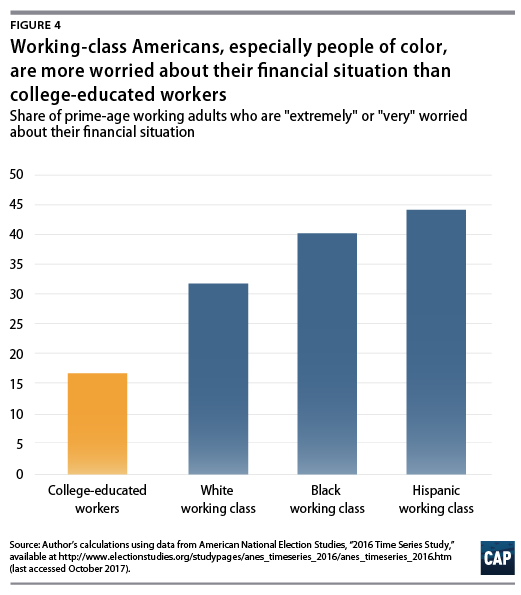
Furthermore, across racial and gender lines, working-class Americans are facing real financial hardship. All members of the working class face the challenges of declining worker power, stagnant pay, and increased costs of key living standards. On average, prime-age members of the working class—those between ages 25 and 54—are more than twice as likely to report being “very” or “extremely” worried about their financial situation as college-educated workers, while black and Hispanic working-class workers report even more economic anxiety than their white counterparts.12
Politicians talk about industrial jobs because they represent full-time employment with a healthy paycheck. The loss of these jobs is a real problem, and the workers left behind from shuttered factories are often unable to find jobs of similar quality in the service sector. But the fact that industrial jobs are of higher quality is no coincidence. For decades, workers in these industries have been more likely to band together in unions, using their bargaining power to improve their pay and working conditions.13
Solutions to address the real concerns and needs of working-class Americans must take into account the true makeup of today’s working class. The nation’s challenge is not only to bring back industrial jobs to the subset of workers on which Trump and others have focused but also to consider the well-being of the broader working class and to raise the quality of jobs in all industries that employ today’s workers. This issue brief presents five findings about the makeup of the working class, which policymakers should keep in mind when addressing this challenge.
Analyzing 75 years of the working class
This analysis uses data on the educational attainment, gender, race, and industry of American workers ages 18 and older in order to measure the composition of the working-class labor force. The data are taken from the decennial U.S. census and the American Community Survey from 1940 to 2015.14
There is not a single, clear definition for the working class. Individuals’ education, income, and occupation all contribute to their class self-identification.15 In this analysis, the working class is defined as comprising all members of the labor force with less than a four-year college degree. This is preferable to an income-based measure, as education is more stable across one’s working lifetime than income. For example, using a measure that defines the working class by a fixed income threshold could result in two workers—who have identical qualifications and work side by side in the same occupation—being classified differently because one has worked at the company longer and is therefore paid more.
However, the measure used for this analysis is not perfect. It certainly excludes some workers who may identify as being in the working class, such as college-educated workers who earn low pay and are seeing their pay grow slowly. It also includes some noncollege-educated adults who are working high-paying jobs and might identify as being in the middle class or upper class.
In 2015, about 65 percent of the U.S. adult population was in the labor force, which encompasses anyone currently employed or looking for a job.16 Of these adults in the labor force, one-third held a bachelor’s degree or higher, while two-thirds held less than a four-year degree.17 This means that, for the purposes of this analysis, 43 percent of American adults were considered working class in 2015.18 Over the previous and current decades, this share of the population has fallen due to increased educational attainment—although women without college degrees have increasingly entered the labor force, which has slowed this decline.19 By comparison, in 1950, according to this same definition, 55 percent of Americans were considered members of the working class.
1. The industrial sector has never made up a majority of working-class employment, and its share is shrinking
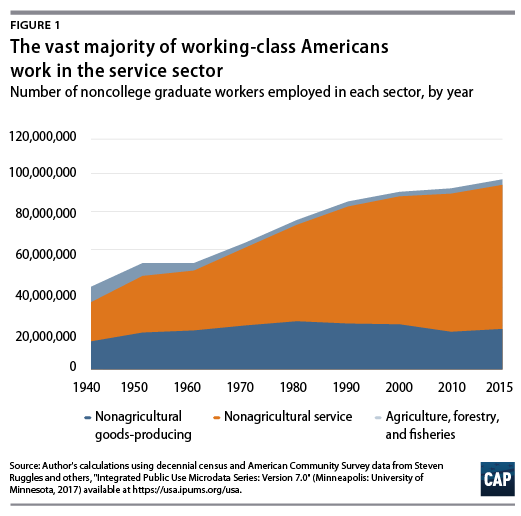
The industries that employ working-class individuals have changed dramatically over the past 75 years. In 1940, about one-third of working Americans who did not have a college degree worked in the manufacturing, construction, and mining industries. Eighteen percent worked in agriculture, forestry, and fisheries; and just less than half—47 percent—worked in the service sector.
Today, about three-quarters of working-class jobs are located in the service sector. Twenty-one percent of working-class workers are employed in industrial sectors. And the share of agricultural working-class employment has plummeted to just 3 percent. (see Figure 1)
Despite the focus placed on this sector, industrial jobs have never made up a majority of U.S. working-class employment.20 The share of working-class workers within the industrial sector peaked in 1960, when they comprised 37 percent of noncollege graduate workers. In terms of raw numbers, these jobs continued to grow until 1980. At this point, 25.1 million members of the working class worked in an industrial job. Since then, the number of industrial jobs has slowly shrunk, even as the noncollege-educated labor force has grown. In 2015, just 21.1 million noncollege graduate workers worked in goods-producing industries.
The jobs that make up most of today’s working class are not those often referenced by campaigning politicians. Instead, when working-class Americans go to work, this work typically and increasingly involves providing services instead of producing goods. In fact, in 2015, more working-class adults—22 million—were employed in the retail industry than in the manufacturing, construction, and mining sectors combined. Additionally, work in the health care industry made up 9.8 percent of working-class jobs in 2015; this share is nearly four times larger than the 2.7 percent of working-class individuals who worked in health care in 1950, and it is larger than today’s working-class construction and mining industries combined.21
2. Over time, the working class is growing more racially diverse
Like the U.S. population as a whole, the American working class has grown much more racially diverse over past decades. Seventy-five years ago, 89.4 percent of the adult U.S. population was white, with white workers similarly making up 88 percent of the working-class labor force. The share of white Americans in the working-class labor force dropped by about 3 percentage points over the next 30 years, reaching 84.9 percent in 1970. This share has fallen even faster in subsequent years, reaching 58.9 percent in 2015. African Americans now make up 13.7 percent of the working class but only 11.9 percent of U.S. adults, while Hispanic Americans make up 20.9 percent of the working class but 15.5 percent of U.S. adults.
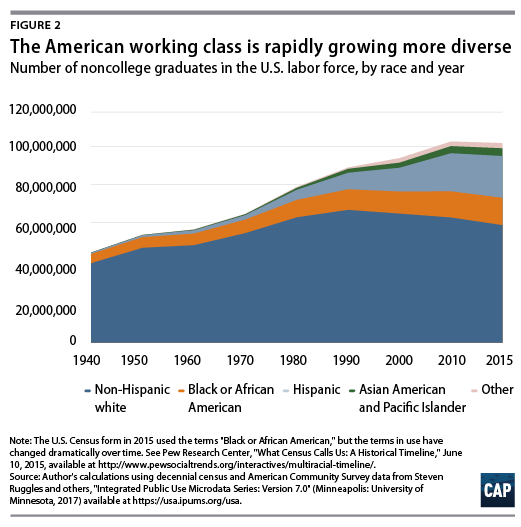
Today’s working-class labor force is dramatically more racially and ethnically diverse than the country’s adult population, which was 64.4 percent white in 2015. This difference is driven by two main forces. One, white Americans are more likely to hold a college degree than African Americans and Hispanic Americans. While 31.9 percent of white American adults had a college degree in 2015, only 18 and 13.2 percent of African American and Hispanic adults did, respectively. Also, a greater share of white Americans is older than the prime working age, thus reducing the share of the white population that is in the labor force. In fact, the Economic Policy Institute’s Valerie Wilson conducted an analysis of labor force and college completion projections that found that by 2032, people of color will make up the majority of the working class ages 18 to 64; this would be 11 years before the entire U.S. population reached that demographic composition.22
However, white workers in the U.S. labor force are more likely to be employed than black and Hispanic workers. In September 2017, the overall white unemployment rate was 3.7 percent, while the black and Hispanic unemployment rates were 7 percent and 5.1 percent, respectively. 23 This disparity is even larger when taking into account members of the labor force without a college degree.24 In order to fight the structural barriers that make it harder for black and Hispanic workers to get jobs, it is crucial that policymakers push for full employment.25 Accommodating monetary policy and public investments can help reduce these still-too-high unemployment rates for workers of color.26
3. Women make up nearly half of today’s working class
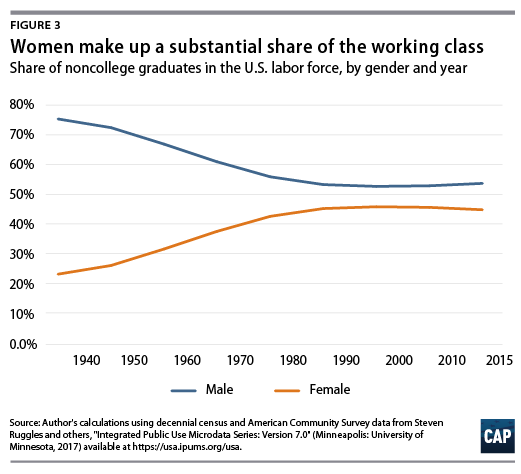
In 1940, the working class—like the labor force broadly—was predominantly made up of men, who totaled 75.9 percent of noncollege workers. This share rapidly declined over subsequent decades as women increasingly entered the labor force and men’s labor force participation fell.27 In 2000, women made up 46.5 percent of the working class, a share that nearly exactly aligned with that of the overall labor force—46.4 percent. After 2000, labor force participation rates fell for both men and women, though women slightly increased their share of the labor force.28 As a result of increased college attainment, the female share of the working class slightly fell, even as their share of the overall labor force rose. In 2015, women made up 45.6 percent of the working class and 47.1 percent of the broader labor force. And in many industries, such as the personal services industry, women currently make up the vast majority of working-class employees. (see Table 4)
The nation’s workplace policies should reflect today’s workforce. For many families, women workers are the main breadwinners, bringing home at least half of family income. In 2015, 42 percent of high school-educated mothers were breadwinners, while 49 percent of mothers with some college education were breadwinners.29 However, the structure of working-class jobs is not always conducive to balancing work and family. Low-wage jobs are less likely to provide paid leave and workplace flexibility.30 Updating work-family policies is key to making it possible for working women to reach their full potential.31
4. While service sector jobs outnumber industrial jobs, their pay and hours do not measure up
While service sector jobs make up the majority of working-class employment, they are often less desirable than jobs in goods-producing industries, typically paying less and being less likely to offer full-time employment. Table 1 provides details on the working-class workers in each major industry classified in census data. In addition to the number of workers in each industry, Table 1 includes earnings data, the share of workers who work full time for the full year, and demographic data.
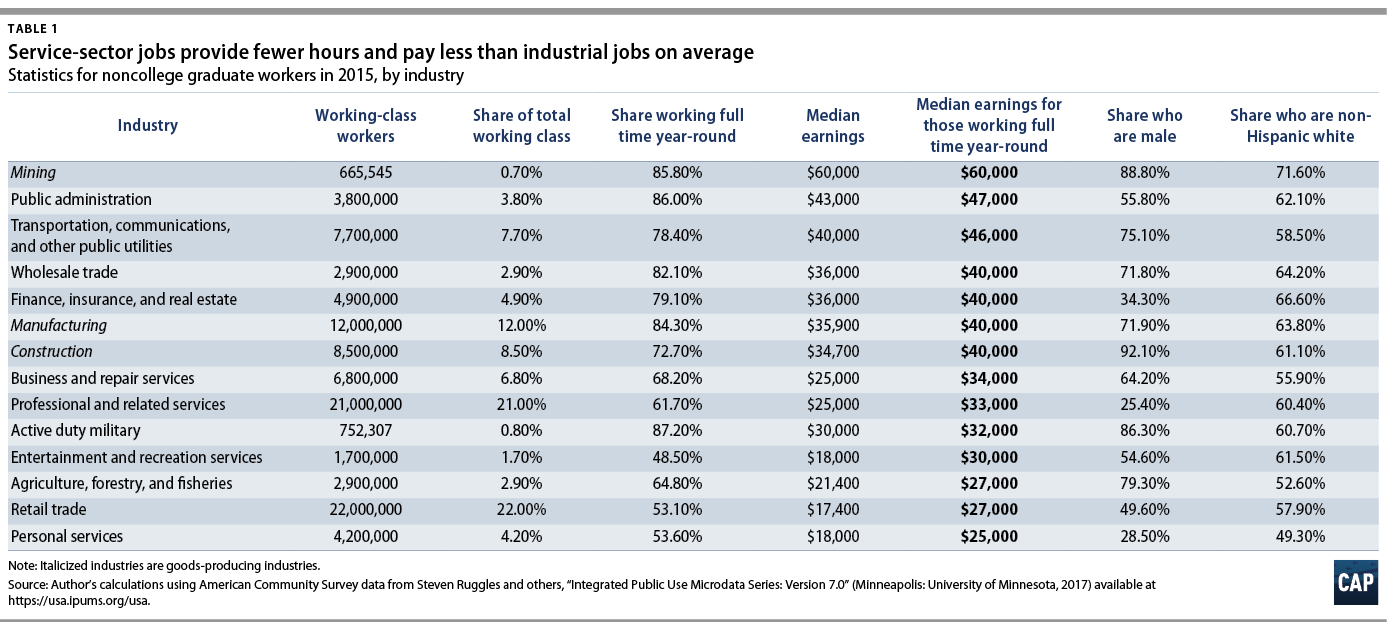
These data show that working-class workers in goods-producing industries are generally more likely to work full time, year round and to earn more. Workers in the professional services and retail trade industries—the former of which includes workers at hospitals, personal care facilities, and schools—make up the largest shares of the working class but are among the lowest paid, with the median worker in each industry earning $25,000 and $17,400, respectively. Conversely, while only 0.7 percent of working-class Americans work in the mining industry, they earn the highest pay by far, with the median worker bringing home $60,000 annually.
The higher pay in goods-producing industries is in part due to the increased power that workers hold.32 Historically, manufacturing, construction, and mining jobs have been more likely to be unionized than jobs in the service sector. For example, in 1973, nearly 40 percent of manufacturing jobs were unionized.33 With that level of membership, even nonunion factories faced high pressure to raise their workers’ wages. While private sector union density has fallen dramatically over the past several years, industrial workers are still more likely to be unionized than service sector workers. In order to reverse the trend of falling union membership, policymakers should consider laws that allow workers to join together across an industry in order to bargain for better pay.34
Table 1 also highlights the gender and racial inequities that exist in working-class employment. Women make up 72 percent of working-class workers in personal services—an industry that includes workers at hotels and in beauty shops. This is, on average, the lowest-paid industry for a full-time, year-round worker without a college degree. Furthermore, more than half of working-class workers in personal services are people of color. In contrast, the highest-paying industry for working-class employment, mining, is composed of the largest share of non-Hispanic white workers and second-largest share of male workers.
It is true that the decline of jobs in goods-producing industries has caused hardships for many families. The focus on industrial jobs is in part a way to symbolize the increasing difficulty of finding a well-paying, full-time job. This analysis finds that, in 2015, the median working-class American working full time, year-round in a goods-producing industry earned $40,000 annually.35 This is 14 percent more than their full-time, year-round counterpart in the service sector. These industrial workers are also more likely to work full time, year round than service sector workers.
But the struggles of the working class will not be solved by a single-minded focus on bringing back manufacturing and mining jobs. As previously discussed, these industries have never employed a majority of the U.S. working class. And in the next 10 years, the jobs projected to grow most quickly are predominantly those that are in the service sector and are low-wage. The U.S. Bureau of Labor Statistics estimates that from 2016 to 2026, our economy will gain a net 10.5 million service sector jobs—including 4 million jobs in health care and social assistance—and only a net 219,000 goods-producing jobs.36 Of the 10 occupations estimated to have the highest growth, in seven of them, the typical employee earns less than the U.S. median annual wage.37
The industrial sector is still an important part of the economy, but policymakers cannot address the true needs of the working class without enacting policies that improve jobs for all of its members, including the 75 million working-class Americans working in the service sector.
5. Working-class workers are more anxious about their finances, but this anxiety is more prevalent among workers of color
Economic hardship and its resulting anxieties are not limited exclusively to workers of a certain race, industry, or region. However, African American and Hispanic members of the working class are often in the direst financial straits. Data from the American National Election Studies (ANES) 2016 Time Series Study—a national survey of more than 4,000 American adults—show that working-class workers ages 25 to 54 are more than twice as likely to report being “extremely” or “very” worried about their financial situation as college-educated, prime-age workers.38 Yet while only 32 percent of white members of the working class are extremely or very worried, 40 percent and 44 percent of black and Hispanic workers, respectively, report this level of anxiety.
Similarly, only 5 percent of college-educated workers report being only “slightly likely” or “not likely at all” to be able to make their housing payments, compared with 15 percent of working-class workers.39 However, this aggregate working-class number hides that while 13 percent of white and 13 percent of Hispanic working-class workers report struggling with upcoming housing payments, 23 percent of black working-class workers report the same.
The increased economic anxiety among black and Hispanic workers is not surprising when considering the fact that working-class workers of color tend to be paid less on the job and, therefore, hold less wealth. In 2015, the median African American and Hispanic working-class worker earned just $24,000 and $23,000 annually, respectively, compared with $30,000 for the median white working-class worker.40 A 2017 Demos report found that while the typical white family led by a worker with less than a high school education has a net worth of $18,800, the typical family led by a black worker who has at least some college education has a net worth of only $11,100.41 It is important to address the needs of the entire working class. However, policymakers must not forget the unique challenges that face African Americans and Hispanic Americans.
Conclusion
Industrial jobs are still an important part of our economy.42 They are more likely to offer well-paying, full-time, year-round employment than the service sector jobs that make up the largest share of working-class employment. But in order to get to a place where all workers have a well-paying job that provides them what they need to support their families, policymakers must work to make today’s service sector jobs of just as high quality as the good industrial jobs that remain.
The struggles of the working class will not be solved by states’ piecemeal efforts to open new factories by luring companies with tax incentives.43 Nor will they be solved through presidential pressure to delay a plant’s outsourcing by another year.44 Instead, policymakers need a broader, bolder policy vision—one that puts the government firmly on the side of workers and their families. Laws should make it easier for these workers to join together in unions, as past and current union organizing has contributed greatly to the increase in the quality of industrial jobs.45 Work-family policies should be updated so that parents can fully participate in the labor force if they so choose.46 Policymakers should push for full employment, using accommodating monetary policy, increased public employment, apprenticeships, and infrastructure investment to set the stage for further job creation.47 The resulting tighter labor markets would likely help raise incomes for those in the private sector as well. All noncollege graduate workers deserve an economy that works better for them. And to rebuild that economy, policymakers must remember the true and changing face of the working class.
Alex Rowell is a research associate for Economic Policy at the Center for American Progress Action Fund.
Endnotes