Report

Governors’ Races that Matter for Climate Action

In the next year, seven states will present voters a choice to change direction on climate action and oppose President Donald Trump’s decision to withdraw the United States from the Paris Agreement on climate change.

Guy Morris, project manager for the Tampa Electric Company's Big Bend Solar Station, works on solar panels on Friday, June 2, 2017, in Gibsonton, Florida. (AP/Chris O’Meara)

Since President Donald Trump announced his intention to withdraw the United States from the Paris Agreement in June, leaders across the country have expressed their support for the global fight against climate change. Governors, mayors, businesses, universities, and the public are demonstrating that Americans remain committed to the success of the Paris Agreement despite the administration’s obstructionism.

Among this chorus, a growing number of U.S. states—including 14, to date, that have joined the U.S. Climate Alliance or the “We Are Still In” coalition—have committed to reduce their carbon pollution and continue supporting the goals of the Paris Agreement.1 These states recognize the risks that climate change poses and the rewards made possible by the transition to a low-carbon and climate-prepared economy, including job creation, technological innovation, and cleaner air. Moreover, these states are acting in accordance with the will of the American people, who currently support U.S. participation in the Paris Agreement by more than a 5-to-1 margin.2 Growing numbers of citizens are committing to fight climate change by signing petitions including the “I Am Still In” petition, through which they can pledge to support climate action to meet the goals of the Paris Agreement.3 These initiatives have been essential in maintaining U.S. progress and leadership on climate change during the Trump administration. But to offset the absence of climate action at the federal level, more states need to join the global effort to counter climate change—and some of those that have joined already need to implement and strengthen their commitments.

President Trump’s intention to withdraw from the Paris Agreement has drawn a clear political line for upcoming elections: Are candidates in or out of the global movement to fight climate change? In 2017 and 2018, several competitive races will offer opportunities to answer this question. Voters will have a choice to elect progressive governors who can change their state’s direction on climate, support the goals of the Paris Agreement, and lead where the president has so far failed.

This issue brief explains what is at stake for states in the face of President Trump’s failure to act on climate change. It then highlights the current state of climate action in seven states with upcoming elections—New Jersey, Florida, Ohio, Wisconsin, Illinois, Michigan, and Virginia—as well as some of the opportunities for the next governors to join the fight and increase their state’s ambition.

What is at stake?

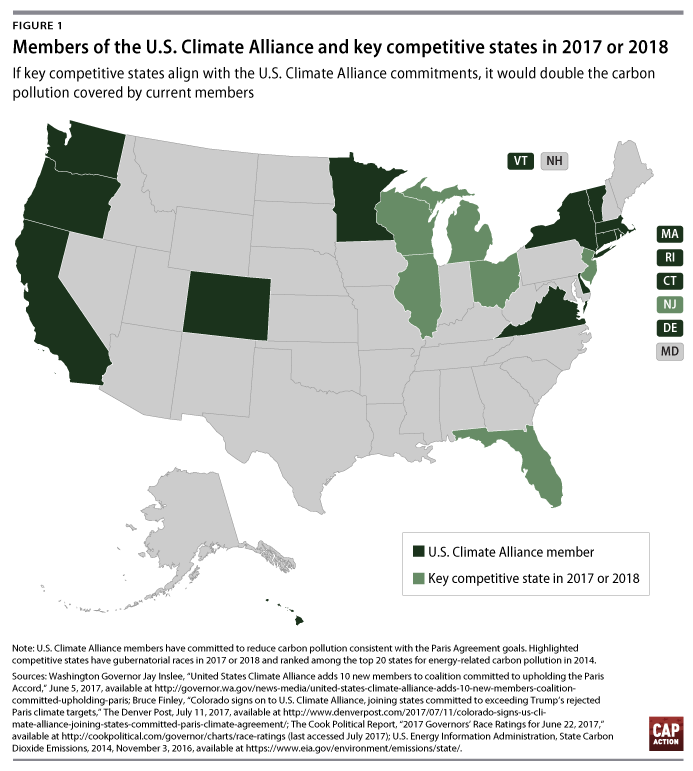
In the wake of President Trump’s abdication of climate leadership, several U.S. states have already stepped up to confront the climate challenge. For example, 13 states and Puerto Rico have joined the U.S. Climate Alliance, which has committed to pursue emissions reductions in line with the goals of the Paris Agreement.4 Together, California, Colorado, Connecticut, Delaware, Hawaii, Massachusetts, Minnesota, New York, Oregon, Rhode Island, Vermont, Virginia, and Washington represented more than 104 million Americans in 2016, as well as nearly $7.1 trillion in economic activity—nearly 38 percent of U.S. gross domestic product. They also represented 16.5 percent of the U.S. energy-related carbon pollution emitted in 2014.5 If these states reduce their collective emissions to at least 26 percent less than 2005 levels by 2025—which matches the U.S. national emissions reduction goal under the Paris Agreement—they would avert nearly 321 million metric tons of carbon dioxide equivalent, or MMT CO2e: the amount of pollution caused by roughly 68 million cars in one year.6 These states are in a position to carry forward U.S. climate leadership, draw like-minded collaborators to their efforts, continue the momentum of clean energy growth, and strengthen the foundation for reengagement at the federal level as soon as the opportunity arises.

For the United States as a whole, however, meaningful action on climate change will require expanding the map of states actively involved in curbing carbon pollution and preparing for its effects—as well as ratcheting up current actions and commitments. To identify near-term opportunities for this, the Center for American Progress Action Fund analyzed the carbon pollution data of states holding gubernatorial races in 2017 and 2018. New Jersey and Virginia are holding races in 2017; 36 other states will hold races in 2018.7 After ranking states with the highest energy-related carbon emissions and identifying gubernatorial races that are likely to be competitive, New Jersey, Florida, Ohio, Wisconsin, Illinois, and Michigan emerged as potential battlegrounds against President Trump’s cynical position on climate change. Additionally, Virginia Gov. Terry McAuliffe’s (D) recent decision to regulate carbon pollution has set the state on a course on which its next governor should continue. Each of these states ranked among the top 20 in terms of energy-related carbon pollution in 2014.8 Among these battleground states, and accounting for the current climate leadership in Virginia, only two states—Illinois and Wisconsin—have incumbent governors who may run for reelection in 2017 and 2018.9

A change in leadership in New Jersey, Florida, Ohio, Wisconsin, Illinois, and Michigan to one with a strong focus on reducing carbon pollution would send a clear message to the White House and the rest of the world that American voters support climate action. Moreover, such a change would significantly increase the nation’s current commitment to cutting carbon pollution: If these states joined the U.S. Climate Alliance, for example, they would approximately double the amount of carbon pollution covered by the coalition’s emissions reduction aspirations.10 And should they meet or exceed their goals under the Environmental Protection Agency’s Clean Power Plan, these six states would avert 86.2 MMT CO2e, or about the same amount as would be achieved by taking 18 million cars off the road for a year.11

The current governors of each of these six states have amassed records on climate change and clean energy that range from inaction to obstruction. This collection of governors includes at least one climate change denier; several who have signed rollbacks of or proposed cuts to state funding for clean energy and efficiency programs; and a number who are cozy with fossil fuel interests that include the Koch brothers. In 2015, five of these states—New Jersey, Florida, Michigan, Ohio, and Wisconsin—joined West Virginia v. EPA, a lawsuit opposing the implementation of the Clean Power Plan.12

Although some of these governors have not stood in the way of clean energy growth in their states, the nation needs bolder action in the face of President Trump’s decisions to withdraw from the Paris Agreement, attack federal clean air and climate protections, dismantle and defund science programs through his fiscal year 2018 budget, and give up on American innovators and businesses competing in global clean energy markets.13 Analysis of these states’ clean energy resources and policies reveals that each has great potential for growth, energy, and cost savings for consumers, job creation, and climate action. The gubernatorial races in New Jersey, Florida, Ohio, Wisconsin, Illinois, and Michigan represent the first opportunities for voters to choose the direction their states take: opposing President Trump’s position on climate change and pursuing new opportunities for economic growth, public health, and environmental protections or lagging behind the competition and forsaking those benefits for current and future generations.

The current state of climate action in New Jersey

In 2011, New Jersey Gov. Chris Christie (R) announced that his state would withdraw from the Regional Greenhouse Gas Initiative (RGGI).14 The nine remaining RGGI member states cooperate to cap and lower carbon pollution from their electric power sectors, generating credits that fund clean energy and efficiency projects within their borders.15 Prior to his announcement, Gov. Christie used $62.5 million in funds generated by RGGI credit auctions to balance New Jersey’s budget, rather than using them for their intended purpose of increasing the state’s energy efficiency or renewable energy use.16 The remaining RGGI states increased their ambition by launching a new reduction target in 2012, and they are now reviewing the RGGI program and goal again, with the potential for increasing further.17

New Jersey by the numbers

State GDP trend, from baseline year 2005 to 2014: 1.1 percent18

Current clean energy employment: 41,418 workers19

Carbon pollution trend, from baseline year 2005 to 2014: -13.1 percent20

A 26 percent reduction in carbon pollution from 2005 levels would amount to: 34 MMT CO2e21

State power sector carbon pollution goal under the Clean Power Plan: 11 percent increase22

Steps forward for New Jersey’s next governor

The timing is well suited for the next governor to rethink Gov. Christie’s decision to leave RGGI. Although only 15 percent of New Jersey’s carbon emissions originate in the electric power sector—a small proportion compared with other states—the state’s next governor should put the state back on a path to cut carbon pollution by rejoining RGGI and restarting the investments in energy efficiency and clean energy that its auctions enable.23 Reversing Christie’s decision on RGGI would also affect the broader electricity market in which New Jersey participates and potentially add more clean energy to the mix for an additional 13 states and the District of Columbia.24

With Gov. Christie’s record ripe for change, New Jersey presents multiple opportunities to cut carbon pollution in the state and beyond its borders. Currently, New Jersey’s 9,239 solar jobs make up the largest share of its electric sector employment, and there are more than 31,000 workers in the field of energy efficiency in the state.25 These numbers illustrate the promise of New Jersey’s momentum to decouple its economic growth from its falling carbon pollution rates.26 With 80 percent of New Jersey voters in support of regulating carbon dioxide as a pollutant, the next governor should act quickly and decisively.27

The current state of climate action in Florida

Florida’s carbon pollution ranks second-highest among state electric power sectors and third-highest among state transportation sectors in the United States.28 The state’s frequent climate change-related events—notably including high tide flooding in Miami Beach and other coastal areas—have begun to affect property values and have increased public concern for global warming to 57 percent of Floridians.29 Yet despite governing a state with clear evidence of the effects of climate change, Gov. Rick Scott (R) has institutionalized climate change denial: His administration banned state officials from using the terms “climate change” and “global warming” in 2015.30 But Florida has nonetheless experienced rapid decoupling of its economic growth from its reliance on coal for electricity generation: Between 2004 and 2015, net generation from coal in the state fell nearly 34 percent due to increased use of natural gas instead of coal, while the economy grew 9 percent.31

Florida by the numbers

State GDP trend, 2005–2014: -1.2 percent32

Current clean energy employment: 123,328 workers33

Carbon pollution trend, 2005–2014: -12.4 percent34

A 26 percent reduction in carbon pollution from 2005 levels would amount to: 67.8 MMT CO2e35

State power sector carbon pollution goal under the Clean Power Plan: -10 percent36

Steps forward for Florida’s next governor

The bright side is that the “Sunshine State” is not a misnomer; in 2016, the National Renewable Energy Laboratory ranked Florida among the very best states for potential solar generation, able to meet up to 47 percent of its own energy demand through rooftop generation alone.37 Solar power is slowly taking off in Florida: In 2016, generation grew 90.5 percent to 522,000 megawatt-hours, or the amount of electricity used by about 48,000 homes.38 Increased investment in solar energy projects in Florida would potentially provide a boon to the state’s current 11,074 solar power workers.39 Even more remarkable, this growth has occurred despite few statewide incentives for clean energy; Florida has no statewide renewable portfolio standard, which requires a percentage of electricity to be generated from renewable sources such as solar.40

Given Florida’s solar power potential, it may surprise Floridians that there are not already more solar installations, but the intense opposition from Duke Energy and Florida Power and Light—two of the state’s major utilities—has held up progress, appearing in full force during the 2016 election season.41 Despite spending $25 million on a misleadingly worded ballot initiative that would have raised the cost of residential rooftop solar panels, the two utilities ultimately failed at the ballot box. But their donations to Gov. Scott, his appointees, and the state legislature indicate that the fight is not over.42

The next Florida governor has a leadership opportunity to address climate change and its long-term effects by harnessing the potential of solar energy in the state and incentivizing it through policies such as a renewable portfolio standard.43 As the cost of solar energy continues to fall, Floridians will benefit from a governor who champions greater access to and incentives for this plentiful resource.44 By harnessing the sun in the Sunshine State, the next governor could easily advance Florida toward its Clean Power Plan goal of a 10 percent carbon pollution reduction from the power sector by 2030.45

The current state of climate action in Ohio

John Kasich, Ohio’s current governor and former Republican presidential candidate, has recently won praise for breaking with his party to veto bills that attacked his state’s renewable portfolio standard and that would have given a $264 million sales tax break to the oil and gas industry.46 But although his recent actions point to a realization of the benefits of clean energy, Gov. Kasich is no champion of climate action. For years, his policies dampened progress and created uncertainty for clean energy growth—including by rolling back provisions of the renewable portfolio standard he later saved.47 Already, the Ohio legislature has begun to consider new ways to charge consumers in order to subsidize two coal-fired power plants that date from 1955. The next governor of Ohio must be vigilant against these attacks and set consistent, clear goals for renewable energy and efficiency deployment early in the new term.48

Ohio by the numbers

State GDP trend, 2005–2014: 5.0 percent49

Current clean energy employment: 87,933 workers50

Carbon pollution trend, 2005–2014: -14.7 percent51

A 26 percent reduction in carbon pollution from 2005 levels would amount to: 70.6 MMT CO2e52

State power sector carbon pollution goal under the Clean Power Plan: -25 percent53

Steps forward for Ohio’s next governor

Given Ohio’s extensive natural gas resources and production in the Marcellus and Utica shale gas regions, the next governor will have opportunities to tackle the mounting challenge of reducing methane pollution.54 In May 2017 alone, Ohio issued permits to 47 new wells in the Utica region after natural gas prices rose in late 2016, and in 2016 Ohio’s 1,561 horizontally drilled wells in the Marcellus and Utica regions produced nearly 1.4 trillion cubic feet of natural gas in total, growing production by 50 percent over 2015 levels.55

In light of President Trump and EPA Administrator Scott Pruitt’s decision not to require oil and gas companies to repair methane leaks, this significant part of Ohio’s energy economy will likely continue to contribute to the state’s significant air and carbon pollution, including nearly 25,000 metric tons of methane emissions, or enough natural gas to heat more than 15,000 homes.56 As the only state in this analysis with extensive oil and gas production within its borders, Ohio presents a critical opportunity, in the absence of federal action, to lead other states to achieve near-term methane pollution reductions, to reduce energy waste, and to save consumers and companies money. Ohio’s next governor will have a crucial responsibility to move the state beyond the uncertain policymaking of Gov. Kasich and into new areas of protecting clean air from methane pollution.

The current state of climate action in Wisconsin

The Koch brothers, fossil fuel billionaires who fund a vast network of political candidates and influential organizations, have contributed greatly to Wisconsin Gov. Scott Walker’s (R) energy policies and opposition to climate change action.57 The Koch brothers and their network of political organizations backed Walker’s gubernatorial campaign with $11 million in 2011 and 2012, helping him defeat a bid for a recall election.58 While in office, Walker has proposed reducing state funding for renewable energy research, launched obstacles to wind turbine siting, and won accolades from the Koch network for suing the EPA over its Clean Power Plan.59 Indicating his allegiance to the Koch brothers, Gov. Walker signed their pledge opposing carbon taxes, closing yet another route to address climate change and promote clean energy resources in Wisconsin.60

Wisconsin by the numbers

State GDP trend, 2005–2014: 6.6 percent61

Current clean energy employment: 67,780 workers62

Carbon pollution trend, 2005–2014: -8.8 percent63

A 26 percent reduction in carbon pollution from 2005 levels would amount to: 28.8 MMT CO2e64

State power sector carbon pollution goal under the Clean Power Plan: -33 percent65

Steps forward for Wisconsin’s next governor

In a state with diverse options for clean energy and efficiency solutions, Gov. Walker’s successor will have many opportunities to turn the tide on climate change, but industrial efficiency and clean energy manufacturing stand out as uniquely tied to Wisconsin’s history and culture. Accounting for nearly one-third of the state’s energy consumption, Wisconsin’s industrial sector offers its next governor opportunities to reduce carbon emissions by increasing industrial efficiency and utilizing existing low-carbon generation for industrial purposes.66

Although Gov. Walker signed a manufacturing and agriculture tax incentive into law in 2011, criticisms of its effectiveness point to the need for the next governor to employ new models.67 Following the Great Recession, Wisconsin’s manufacturing sector has returned to an employment rate of approximately 468,000 from a low of 424,000 in 2010, but more can be done to create manufacturing jobs in the state.68 In 2010, Wisconsin used American Recovery and Reinvestment Act funding to capitalize its Clean Energy Manufacturing Revolving Loan Fund with $55 million.69 These loans have financed companies that include a wind turbines parts supplier, as well as waste-to-energy efforts. Additional Recovery Act funds and tax credits have financed equipment manufacturers that produce electricity transformers and other grid and renewable energy components.70

President Trump’s fiscal year 2018 budget proposes cuts to advanced manufacturing, clean energy research and development, and workforce training programs.71 The growing wind energy market in Iowa and other Midwestern states has already increased demand for wind turbine parts and may benefit Wisconsin manufacturers.72 Additionally, Wisconsin stands out among Midwestern states because Gov. Walker has not joined the bipartisan Governors’ Wind and Solar Energy Coalition, a group that promotes the development of clean energy resources and markets.73

Reversing Gov. Walker’s decisions to limit clean energy growth on the electric grid and crafting new incentives for clean energy manufacturing would nurture these in-state energy resources and companies.74 The next Wisconsin governor should break from Walker, the Koch brothers, and President Trump by instituting tax incentives specifically for clean energy manufacturing and increasing state contributions to the existing Clean Energy Manufacturing Revolving Loan Fund. Moving forward on manufacturing and wind energy represents one of many options for Wisconsin’s next governor to reduce carbon pollution by 26 percent, or approximately 29 MMT CO2e—the amount of carbon pollution created by more than 6 million cars in one year.75

The current state of climate action in Illinois

The recent passage of Illinois’ energy bill won praise from clean energy advocates and electric utilities alike, albeit for different reasons. The bill represents a compromise between the utilities that sought support for existing nuclear plants that would otherwise be retired and clean energy advocates who sought updates to the state’s renewable portfolio standard and efficiency policies.76 Despite Gov. Bruce Rauner’s (R) support for the bill, his office’s reported opposition to fair labor law requirements for renewable energy projects cast last-minute doubts over its passage.77 The ongoing Illinois budget debate has shown Gov. Rauner’s cards on clean energy: A proposal that he endorsed would eliminate $185 million in funding for the central solar energy provision of the Future Energy Jobs bill he championed.78

Transportation-related carbon pollution accounts for nearly 28 percent of Illinois’ total carbon emissions.79 To date, Gov. Rauner has done little to foster the growth of alternative fuels and electric vehicles or to join broader efforts to increase fuel efficiency. He has actively impeded the expansion of Illinois’ electric vehicle networks by suspending the state’s electric vehicle rebate program, which provided customers $4,000 per car in 2015.80 Additionally, his budget plan for 2016 proposed cuts to Chicago’s regional rail network and the L, its mass transit system.81

Illinois by the numbers

State GDP trend, 2005–2014: 5.1 percent82

Current clean energy employment: 97,633 workers83

Carbon pollution trend, 2005–2014: -4.0 percent84

A 26 percent reduction in carbon pollution from 2005 levels would amount to: 63.4 MMT CO2e85

State power sector carbon pollution goal under the Clean Power Plan: -26 percent86

Steps forward for Illinois’ next governor

The next governor of Illinois should implement the Future Energy Jobs Act; secure carbon pollution reductions that the state will earn in line with the state’s Clean Power Plan goal of a 22 MMT CO2e—or 26 percent—reduction from 2012 levels by 2030; and seek additional means to reduce carbon emissions outside the power sector.87 At the same time, the next governor should tackle the state’s transportation-related carbon emissions by building on the existing network that, as of June 2017, consisted of 400 public electric vehicle-charging stations and more than 900 charging outlets.88

The next Illinois governor should also think bigger than Gov. Rauner has in terms of regional planning and funding for transit. The choice for Illinois voters in 2018 may determine whether the state will join California in any upcoming political and legal battles over the Trump administration’s changes to fuel economy standards.89 The idea has precedent: In 2007, the now-defunct Illinois Climate Change Advisory Group proposed aligning the state’s fuel efficiency standards with California’s progressive standards.90 Currently, 13 states—including several U.S. Climate Alliance members and New Jersey—have aligned with California’s efficiency standards, and nine states have also adopted its zero-emissions vehicle standards.91

The current state of climate action in Michigan

As leader of a state with many automobile companies, factories, and parts suppliers, Michigan’s next governor will enter office during a transformational time for the U.S. transportation system. Michigan is host to more than 1,700 automobile-related manufacturing companies, which employ more than 165,000 workers in the state.92 Current Gov. Rick Snyder (R) has expressed support for the Trump administration’s review of federal fuel economy standards, which critics fear will roll back the energy- and cost-saving standards known as Corporate Average Fuel Economy (CAFE) standards.93 This follows Gov. Snyder’s opposition to the Obama administration’s CAFE standards rulemaking process in 2011 and 2012, which raised the fuel economy standard to 54.5 miles per gallon in model year 2025.94

Much like its Midwestern neighbors, Michigan has net metering policies and a renewable portfolio standard in place, and although a bipartisan measure increased the standard to 15 percent, progressives in the state are eager to do more.95 Although Michigan’s electric power and transportation sectors produce most of its carbon emissions—37 percent and 30 percent, respectively—it also sees significant emissions from residential and commercial buildings, at 21 percent.96 Michigan’s cold winters have driven up energy use for space and water heating needs in homes and businesses, with 76.9 percent of Michiganders heating their homes with natural gas and a further 9.7 percent using other fossil fuel products.97 If President Trump’s budget cuts for weatherization and home energy assistance pass, Michigan’s low-income families will be out in the cold due to a funding shortfall that would otherwise provide energy assistance to more than 468,000 households and efficiency upgrades to more than 3,000 homes.98

Michigan by the numbers

State GDP trend, 2005–2014: -4.6 percent99

Current clean energy employment: 97,470 workers100

Carbon pollution trend, 2005–2014: -14.7 percent101

A 26 percent reduction in carbon pollution from 2005 levels would amount to: 49.6 MMT CO2e102

State power sector carbon pollution goal under the Clean Power Plan: -31 percent103

Steps forward for Michigan’s next governor

Both vehicle fuel economy and transportation-related carbon pollution are on the rise, posing an ongoing challenge for every governor. Michigan’s next governor, however, may be able to transform this challenge into an opportunity.104 The next governor of Michigan should collaborate with governors in other states critical to the U.S. auto industry to promote the manufacture of technologies critical to fuel efficiency and electric and alternative fuel vehicles through state funding, tax policies, and other mechanisms. Michigan voters could choose to build momentum for climate action in the Midwest, contributing not only to regional electric power sector changes but also to tackling building efficiency and reducing fossil fuel use for heating. Increasing building efficiency and incentivizing the electrification of water and building heating systems in retrofits or new buildings would begin to lower carbon emissions from the residential and commercial sectors.

The example of Virginia in the fight against climate change

The 2017 gubernatorial race in Virginia exemplifies the crucial argument that the potential for climate action does not rest solely on changing the direction of a handful of states. It is also dependent on building upon the momentum and resolve that leaders around the country have already shown. Already, Virginians have experienced serious effects of sea level rise, such as flooding in the Norfolk area, and the U.S. military has incorporated climate change into its plans for several bases in the Hampton Roads area.105 The state’s energy-related carbon pollution fell between 2005 and 2014 primarily due to fuel switching from coal to natural gas, and in the past year, small- and utility-scale solar energy resources have increased by a factor of six, from just over 22 megawatts to more than 136 megawatts—a modest but promising start.106 With more than 75,000 workers in the field of energy efficiency, Virginia also has a clear foundation for clean energy employment growth and has experienced rapid economic growth, while its carbon pollution rate has fallen by more than 15 percent.107

Virginia by the numbers

State GDP trend, 2005–2014: 6.6 percent108

Current clean energy employment: 81,150 workers109

Carbon pollution trend, 2005–2014: -19.5 percent110

A 26 percent reduction in carbon pollution from 2005 levels would amount to: 33.6 MMT CO2e111

State power sector carbon pollution goal under the Clean Power Plan: 7 percent increase 112

Continuing the momentum in Virginia

The potential to build on the above factors in Virginia’s economy and on current Gov. Terry McAuliffe’s leadership on climate change and commitment to the U.S. Climate Alliance will soon rest in the hands of Virginia’s next governor.113 During the gubernatorial primary, candidates from all parties outlined their arguments for and against President Trump’s decision to withdraw from the Paris Agreement.114 In May 2017, Gov. McAuliffe directed the state government to put carbon pollution rules in place before he leaves office in January 2018.115 As state officials develop those rules and as the governor’s race moves forward, it will remain incumbent on progressives to press all candidates on their position on the Paris Agreement and their plans to implement the state’s carbon pollution program and additional efforts in the fight against climate change.

Conclusion

The 2017 and 2018 gubernatorial elections will determine the course that the United States takes on many issues, but voters in the seven states discussed in this brief can have an incredible impact by voicing their desire for new leadership and greater ambition on climate change. President Trump and his Republican allies are looking the other way while the world’s climate heats up. But voters now have a choice to elect leaders who will seize the opportunities presented by the clean energy economy—opportunities that the rest of the world has already embraced that will not only offer economic benefits but also help protect the nation’s clean air and climate.

Luke H. Bassett is the associate director of domestic energy policy at the Center for American Progress. Christy Goldfuss is the vice president for energy and environment policy at the Center.

The authors thank Gwynne Taraska for her significant contributions to this issue brief.

Endnotes

Endnotes

  1. At the time of this analysis, energy-related carbon emissions data for Puerto Rico were unavailable; it has thus been excluded. The U.S. Climate Alliance includes 13 states as of July 11, 2017, and the We Are Still In effort includes nine, all of which are also members of the U.S. Climate Alliance with the exception of North Carolina. Subsequent quantitative analysis of these state commitments focuses on the U.S. Climate Alliance members. U.S. Climate Alliance, “Home,” available at https://www.usclimatealliance.org (last accessed July 2017); Washington Governor Jay Inslee, “United States Climate Alliance Adds 10 New Members to Coalition Committed to Upholding the Paris Accord,” Press release, June 5, 2017, available at http://governor.wa.gov/news-media/united-states-climate-alliance-adds-10-new-members-coalition-committed-upholding-paris; Bruce Finley, “Colorado Signs On to U.S. Climate Alliance, Joining States Committed to Exceeding Trump’s Rejected Paris Climate Targets,” The Denver Post, July 16, 2017, available at http://www.denverpost.com/2017/07/11/colorado-signs-us-climate-alliance-joining-states-committed-paris-climate-agreement; We Are Still In, “Open Letter to the International Community and Parties to the Paris Agreement From U.S. State, Local, and Business Leaders,” available at http://www.wearestillin.com (last accessed July 2017).
  2. Jennifer Marlon, Eric Fine, and Anthony Leiserowitz, “Majorities of Americans in Every State Support Participation in the Paris Agreement,” Yale Program on Climate Change Communication, May 8, 2017, available at http://climatecommunication.yale.edu/publications/paris_agreement_by_state.
  3. #IAmStillIn, “Tell the 194 Countries Committed to the Paris Agreement That You’re Still In,” available at https://iamstillin.org (last accessed July 2017).
  4. U.S. Climate Alliance, “Home”; Washington Governor Jay Inslee, “United States Climate Alliance Adds 10 New Members to Coalition Committed to Upholding the Paris Accord.”
  5. The most recent energy-related carbon emissions data published by the U.S. Energy Information Administration are updated through 2014; all other state or national data are current through 2016 unless otherwise noted. Bureau of the Census, Annual Estimates of the Resident Population for the United States, Regions, States, and Puerto Rico: April 1, 2010 to July 1, 2016 (U.S. Department of Commerce, 2016), available at https://www.census.gov/data/tables/2016/demo/popest/state-total.html; Bureau of Economic Analysis, Gross Domestic Product by State: Fourth Quarter and Annual 2016, (U.S. Department of Commerce, 2017), available at https://bea.gov/newsreleases/regional/gdp_state/2017/pdf/qgsp0517.pdf; U.S. Energy Information Administration, State Carbon Dioxide Emissions: 2014, (U.S. Department of Energy, 2016), available at https://www.eia.gov/environment/emissions/state.
  6. United Nations Framework Convention on Climate Change, “U.S. Cover Note INDC and Accompanying Information” (2015), available at http://www4.unfccc.int/submissions/INDC/Published%20Documents/United%20States%20of%20America/1/U.S.%20Cover%20Note%20INDC%20and%20Accompanying%20Information.pdf; U.S. Environmental Protection Agency, Inventory of U.S. Greenhouse Gas Emissions and Sinks: 1990–2015: 2017 Main Report Tables (2017), available at https://www.epa.gov/ghgemissions/inventory-us-greenhouse-gas-emissions-and-sinks-1990-2015; U.S. Energy Information Administration, State Carbon Dioxide Emissions; U.S. Environmental Protection Agency, “Greenhouse Gas Equivalencies Calculator,” available at https://www.epa.gov/energy/greenhouse-gas-equivalencies-calculator (last accessed June 2017).
  7. The Cook Political Report, “2017 Governors Race Ratings for June 22, 2017,” available at http://cookpolitical.com/governor/charts/race-ratings (last accessed July 2017).
  8. U.S. Energy Information Administration, State Carbon Dioxide Emissions.
  9. The Cook Political Report, “2017 Governors Race Ratings for June 22, 2017.”
  10. Note on methodology: The current members of the U.S. Climate Alliance have committed to pursue collective emissions reductions in line with the goals of the Paris Agreement. Under the agreement, the U.S. national emissions reduction goal is 26 percent to 28 percent less than 2005 levels by 2025. CAP calculates that such a target applied to the 13 states in the alliance would be approximately 321 MMT CO2e. The addition of New Jersey, Florida, Ohio, Wisconsin, Illinois, and Michigan to the coalition would result in an additional 314 MMT CO2e, or nearly double the current aspirational reduction goal. U.S. Climate Alliance, “Home”; Washington Governor Jay Inslee, “United States Climate Alliance Adds 10 New Members to Coalition Committed to Upholding the Paris Accord”; U.S. Energy Information Administration, State Carbon Dioxide Emissions.
  11. Clean Power Plan state baseline data for 2012 were calculated by adding steam and combined cycle data from the Clean Power Plan Technical Support Document. Clean Power Plan state goals were calculated to include the New Source Complement cap, also according to the Technical Support Document. Both sets of calculations used the EPA’s mass-based data and exclude Alaska, Hawaii, and Vermont, just as the Clean Power Plan does. U.S. Environmental Protection Agency, Data File: Goal Computation Appendix 1-5 (2015), available at https://archive.epa.gov/epa/cleanpowerplan/clean-power-plan-final-rule-technical-documents.html; U.S. Environmental Protection Agency, New Source Complements to Mass Goals: Technical Support Document for CPP: Final Rule (2015), available at https://www.epa.gov/sites/production/files/2015-11/documents/tsd-cpp-new-source-complements.pdf; U.S. Environmental Protection Agency, “Greenhouse Gas Equivalencies Calculator.”
  12. Timothy Cama, “Two Dozen States Sue Obama Over Coal Plant Emissions Rule,” The Hill, October 23, 2015, available at http://thehill.com/policy/energy-environment/257856-24-states-coal-company-sue-obama-over-climate-rule; Coral Davenport, “Appeals Court Hears Challenge to Obama’s Climate Change Rules,” The New York Times, September 27, 2016, available at https://www.nytimes.com/2016/09/28/us/politics/appeals-court-hears-challenge-to-obamas-climate-change-rules.html.
  13. The White House Office of the Press Secretary, “Statement by President Trump on the Paris Climate Accord,” Press release, June 1, 2017, available at https://www.whitehouse.gov/the-press-office/2017/06/01/statement-president-trump-paris-climate-accord; The White House Office of the Press Secretary, “Presidential Executive Order on Promoting Energy Independence and Economic Growth,” Press release, March 28, 2017, available at https://www.whitehouse.gov/the-press-office/2017/03/28/presidential-executive-order-promoting-energy-independence-and-economi-1; Office of Management and Budget, A New Foundation for American Greatness: Budget of the U.S. Government, Fiscal Year 2018 (Executive Office of the President, 2017), available at https://www.whitehouse.gov/sites/whitehouse.gov/files/omb/budget/fy2018/budget.pdf.
  14. Christopher Baxter, “Gov. Christie Announces N.J. Pulling Out of Regional Environmental Initiative,” NJ.com, May 28, 2011, available at http://www.nj.com/politics/index.ssf/2011/05/gov_christie_to_announce_nj_pu.html; Jonathan D. Salant, “Christie’s Withdrawal From Air Pollution Compact Has Cost N.J. $114M, Pallone Says,” NJ.com, March 17, 2015, available at http://www.nj.com/politics/index.ssf/2015/03/rep_pallone_says_christies_withdrawal_from_regiona.html.
  15. Regional Greenhouse Gas Initiative, “Welcome,” available at https://www.rggi.org (last accessed July 2017).
  16. Baxter, “Gov. Christie Announces N.J. Pulling Out of Regional Environmental Initiative.”
  17. Regional Greenhouse Gas Initiative, “2016 Program Review,” available at https://www.rggi.org/design/2016-program-review (last accessed July 2017).
  18. GDP in chained 2009 dollars. Bureau of Economic Analysis, “Regional Data: GDP and Personal Income,” available at https://www.bea.gov/iTable/index_regional.cfm (last accessed July 2017).
  19. Calculations include state energy employment for energy efficiency, solar, wind, and hydroelectric generation jobs. U.S. Department of Energy, U.S. Energy and Employment Report: State Charts (2017), available at https://energy.gov/downloads/2017-us-energy-and-employment-report.
  20. Stuart A. Thompson and Vikas Bajaj, “The Green Energy Revolution Will Happen Without Trump,” The New York Times, June 20, 2017, available at https://www.nytimes.com/interactive/2017/06/20/opinion/green-energy-revolution-trump.html.
  21. Members of the U.S. Climate Alliance commit to reduce collective emissions in line with the goals of the Paris Agreement. Under the agreement, the U.S. national emissions reduction goal is 26 percent to 28 percent less than 2005 levels by 2025, although this is not a target that the alliance has committed to on a state-by-state basis. U.S. Climate Alliance, “Home”; U.S. Energy Information Administration, State Carbon Dioxide Emissions; United Nations Framework Convention on Climate Change, “U.S. Cover Note INDC and Accompanying Information.”
  22. The Clean Power Plan goal calculations set a power sector emissions goal that is 11 percent higher than the 2012 baseline for New Jersey. U.S. Environmental Protection Agency, Data File: Goal Computation Appendix 1-5; U.S. Environmental Protection Agency, New Source Complements to Mass Goals.
  23. U.S. Energy Information Administration, State Carbon Dioxide Emissions.
  24. PJM Interconnection, “Who We Are,” available at http://www.pjm.com/about-pjm/who-we-are.aspx (last accessed July 2017).
  25. U.S. Department of Energy, U.S. Energy and Employment Report: State Charts.
  26. Thompson and Bajaj, “The Green Energy Revolution Will Happen Without Trump.”
  27. Jennifer Marlon and others, “Yale Climate Opinion Maps – U.S. 2016,” Yale Program on Climate Change Communication, http://climatecommunication.yale.edu/visualizations-data/ycom-us-2016 (last accessed July 2017).
  28. U.S. Energy Information Administration, State Carbon Dioxide Emissions.
  29. Ian Urbina, “Perils of Climate Change Could Swamp Coastal Real Estate,” The New York Times, November 24, 2016, available at https://www.nytimes.com/2016/11/24/science/global-warming-coastal-real-estate.html (last accessed July 2017); Marlon and others, “Yale Climate Opinion Maps – U.S. 2016.”
  30. Tristram Korten, “In Florida, Officials Ban Term ‘Climate Change,’” Miami Herald, March 8, 2015, available at http://www.miamiherald.com/news/state/florida/article12983720.html; Tristram Korten, “Gov. Rick Scott’s Ban on Climate Change Term Extended to Other State Agencies,” March 11, 2015, available at http://www.miamiherald.com/news/state/florida/article13576691.html.
  31. Thompson and Bajaj, “The Green Energy Revolution Will Happen Without Trump”; U.S. Energy Information Administration, “Florida Electricity Profile 2015” (2017), available at https://www.eia.gov/electricity/state/Florida; Bureau of Economic Analysis, “Regional Data: GDP and Personal Income.”
  32. GDP in chained 2009 dollars. Bureau of Economic Analysis, “Regional Data: GDP and Personal Income.”
  33. Calculations include state energy employment for energy efficiency, solar, wind, and hydroelectric generation jobs. U.S. Department of Energy, U.S. Energy and Employment Report: State Charts.
  34. Thompson and Bajaj, “The Green Energy Revolution Will Happen Without Trump.”
  35. U.S. Energy Information Administration, State Carbon Dioxide Emissions; United Nations Framework Convention on Climate Change, “U.S. Cover Note INDC and Accompanying Information.”
  36. U.S. Environmental Protection Agency, Data File: Goal Computation Appendix 1-5; U.S. Environmental Protection Agency, New Source Complements to Mass Goals.
  37. Pieter Gagnon and others, “Rooftop Solar Photovoltaic Technical Potential in the United States: A Detailed Assessment” (Golden, CO: National Renewable Energy Laboratory, 2016), available at http://www.nrel.gov/docs/fy16osti/65298.pdf.
  38. U.S. Energy Information Administration, Electric Power Monthly With Data for December 2016 (U.S. Department of Energy, 2017), available at https://www.eia.gov/electricity/monthly/current_year/february2017.pdf; U.S. Energy Information Administration, “Frequently Asked Questions: How Much Electricity Does an American Home Use?”, available at https://www.eia.gov/tools/faqs/faq.php?id=97&t=3 (last accessed July 2017).
  39. U.S. Department of Energy, U.S. Energy and Employment Report: State Charts.
  40. North Carolina Clean Energy Technology Center, Database of State Incentives for Renewables and Efficiency (DSIRE), “Programs,” available at http://programs.dsireusa.org/system/program (last accessed July 2017).
  41. Mary Ellen Klas, “As Rooftop Solar Costs Drop, Utility Attempts to Raise Barriers May Not Work,” Miami Herald, November 12, 2016, available at http://www.miamiherald.com/news/politics-government/election/article114377458.html.
  42. Mary Ellen Klas, “Florida Voters Say No to Misleading Solar Amendment,” Miami Herald, November 8, 2016, available at http://www.miamiherald.com/news/politics-government/election/article113449438.html; Mary Ellen Klas, “Solar Advocates File Suit to Block ‘Misleading’ Amendment 1,” Miami Herald, November 2, 2016, available at http://www.miamiherald.com/news/politics-government/election/article112065122.html; Julia Pyper, “Florida Voters Defeat Utility-Backed Solar Amendment,” Greentech Media, November 9, 2016, available at https://www.greentechmedia.com/articles/read/florida-voters-defeat-utility-backed-solar-amendment.
  43. National Renewable Energy Laboratory, “Renewable Portfolio Standards,” available at http://www.nrel.gov/tech_deployment/state_local_governments/basics_portfolio_standards.html (last accessed July 2017).
  44. U.S. Department of Energy, Revolution…Now: The Future Arrives for Five Clean Energy Technologies – 2016 Update (2016), available at https://www.energy.gov/sites/prod/files/2016/09/f33/Revolutiona%CC%82%E2%82%ACNow%202016%20Report_2.pdf.
  45. U.S. Environmental Protection Agency, Data File: Goal Computation Appendix 1-5; U.S. Environmental Protection Agency, New Source Complements to Mass Goals.
  46. Dan Gearino, “Kasich Vetoes Bill Weakening Clean-Energy Standards,” The Columbus Dispatch, December 27, 2016, available at http://www.dispatch.com/content/stories/business/2016/12/27/kasich-energy-legislation.html.
  47. John Funk, “Ohio Renewable Energy and Efficiency Rules Frozen for Two Years as Gov. John Kasich Signs Legislation,” Cleveland.com, June 16, 2014, available at http://www.cleveland.com/business/index.ssf/2014/06/ohio_renewable_energy_and_effi.html.
  48. Dan Gearino, “Bill in Ohio House Would Permanently Subsidize 2 Coal-Fired Power Plants,” The Columbus Dispatch, May 24, 2017, available at http://www.dispatch.com/news/20170524/bill-in-ohio-house-would-permanently-subsidize-2-coal-fired-power-plants.
  49. GDP in chained 2009 dollars. Bureau of Economic Analysis, “Regional Data: GDP and Personal Income.”
  50. Calculations include state energy employment for energy efficiency, solar, wind, and hydroelectric generation jobs. U.S. Department of Energy, U.S. Energy and Employment Report: State Charts.
  51. Thompson and Bajaj, “The Green Energy Revolution Will Happen Without Trump.”
  52. U.S. Energy Information Administration, State Carbon Dioxide Emissions; United Nations Framework Convention on Climate Change, “U.S. Cover Note INDC and Accompanying Information.”
  53. U.S. Environmental Protection Agency, Data File: Goal Computation Appendix 1-5; U.S. Environmental Protection Agency, New Source Complements to Mass Goals.
  54. U.S. Energy Information Administration, “Ohio Natural Gas Gross Withdrawals” (2017), available at https://www.eia.gov/dnav/ng/hist/n9010oh2m.htm (last accessed July 2017).
  55. Argus Media, “Ohio Utica Well Permits Recover in May,” June 8, 2017, available at http://www.argusmedia.com/news/article/?id=1475928; Ohio Department of Natural Resources Division of Oil and Gas Resources, “2016 Utica & Marcellus: 2016 Horizontal Production – Annual” (2016), available at http://oilandgas.ohiodnr.gov/production#QUART (last accessed July 2017); Dan Gearino, “Ohio’s Natural-Gas Production Soared During a Down Year Nationally,” The Columbus Dispatch, April 27, 2017, available at http://www.dispatch.com/news/20170427/ohios-natural-gas-production-soared-during-down-year-nationally.
  56. U.S. Environmental Protection Agency, Oil and Natural Gas Sector: Emission Standards for New, Reconstructed, and Modified Sources; Grant of Reconsideration and Partial Stay (2017), available at https://www.epa.gov/sites/production/files/2017-05/documents/frn_90daystay.pdf; Environmental Defense Fund, “Ohio’s Methane Pollution Problem” (2016), available at https://www.edf.org/sites/default/files/content/methane_fact_sheet_ohio_final_112816.pdf.
  57. Jane Mayer, Dark Money: The Hidden History of the Billionaires Behind the Rise of the Radical Right, (New York: Doubleday, 2016); Steven Elbow, “Scott Walker Among Signers of Koch-Backed ‘No Climate Tax Pledge,’” Madison.com, July 3, 2013, available at http://host.madison.com/news/local/writers/steven_elbow/scott-walker-among-signers-of-koch-backed-no-climate-tax/article_6b078010-1304-58a9-8e80-ea384a251c33.html.
  58. Phil Hirschkorn and Nancy Cordes, “A Record Amount of Money Spent on Wisconsin Recall,” CBS News, June 7, 2012, available at http://www.cbsnews.com/news/a-record-amount-of-money-spent-on-wisconsin-recall.
  59. Thomas Content and Lee Bergquist, “Scott Walker Wants to End Funding for Renewable Energy Program,” Milwaukee Journal Sentinel, February 28, 2015, available at http://www.jsonline.com/news/statepolitics/scott-walker-wants-to-end-funding-for-renewable-energy-program-b99452612z1-294532231.html; Thomas Content, “Wind Turbine Issue Turns Slowly,” Milwaukee Journal Sentinel, October 23, 2011, available at http://www.jsonline.com/business/wind-turbine-issue-turns-slowly-132420203.html; David Fladeboe, “Gov. Walker Is Right to Sue the EPA,” Milwaukee Journal Sentinel, February 28, 2015, available at http://www.jsonline.com/news/opinion/gov-scott-walker-is-right-to-sue-the-epa-b99452624z1-294458891.html.
  60. Elbow, “Scott Walker Among Signers of Koch-Backed ‘No Climate Tax Pledge.’”
  61. GDP in chained 2009 dollars. Bureau of Economic Analysis, “Regional Data: GDP and Personal Income.”
  62. Calculations include state energy employment for energy efficiency, solar, wind, and hydroelectric generation jobs. U.S. Department of Energy, U.S. Energy and Employment Report: State Charts.
  63. Thompson and Bajaj, “The Green Energy Revolution Will Happen Without Trump.”
  64. U.S. Energy Information Administration, State Carbon Dioxide Emissions; United Nations Framework Convention on Climate Change, “U.S. Cover Note INDC and Accompanying Information.”
  65. U.S. Environmental Protection Agency, Data File: Goal Computation Appendix 1-5; U.S. Environmental Protection Agency, New Source Complements to Mass Goals.
  66. U.S. Energy Information Administration, “Wisconsin: State Profile and Energy Estimates,” available at https://www.eia.gov/state/?sid=WI (last accessed July 2017).
  67. Katelyn Ferral, “Wisconsin’s Sweeping Manufacturing and Agriculture Tax Credit Reaches Full Force This Year,” The Capital Times, May 16, 2016, available at http://host.madison.com/ct/news/local/govt-and-politics/wisconsin-s-sweeping-manufacturing-and-agriculture-tax-credit-reaches-full/article_21300bb8-3ea3-5210-9596-b1a0ad287f0e.html.
  68. Bureau of Labor Statistics, “State and Area Employment, Hours, and Earnings: Wisconsin, 2007–2017,” available at https://data.bls.gov/timeseries/SMS55000003000000001?amp%253bdata_tool=XGtable&output_view=data&include_graphs=true (last accessed July 2017).
  69. Wisconsin State Energy Office, “Clean Energy Manufacturing Revolving Loan Fund,” February 2017, available at http://www.stateenergyoffice.wi.gov/section.asp?linkid=1846&locid=160 (last accessed July 2017).
  70. Wisconsin State Energy Office, “Success Stories,” available at http://www.stateenergyoffice.wi.gov/category.asp?linkcatid=3859&linkid=1846&locid=160 (last accessed July 2017); U.S. Department of Energy, Recovery Act State Memos: Wisconsin (2010), available at https://www.energy.gov/sites/prod/files/edg/recovery/documents/Recovery_Act_Memo_Wisconsin.pdf.
  71. Office of Management and Budget, A New Foundation for American Greatness.
  72. Kate Archer Kent, “Wisconsin Manufacturers Gear Up for Wind Farm Orders From Other States,” Wisconsin Public Radio, August 3, 2016, available at http://www.wpr.org/wisconsin-manufacturers-gear-wind-farm-orders-other-states.
  73. Governors’ Wind and Solar Energy Coalition, “Welcome,” available at http://www.governorswindenergycoalition.org (last accessed July 2017); Governor’s Wind and Solar Energy Coalition, “Coalition Members,” available at http://governorswindenergycoalition.org/coalition-members/ (last accessed July 2017).
  74. Kari Lydersen, “On Utilities and Solar, Wisconsin Goes Its Own Way,” Midwest Energy News, December 3, 2014, available at http://midwestenergynews.com/2014/12/03/on-utilities-and-solar-wisconsin-goes-its-own-way.
  75. United Nations Framework Convention on Climate Change, “U.S. Cover Note INDC and Accompanying Information”; U.S. Energy Information Administration, State Carbon Dioxide Emissions; U.S. Environmental Protection Agency, “Greenhouse Gas Equivalencies Calculator.”
  76. Julia Pyper, “Clean Energy Advocates Praise Passage of Major Illinois Energy Bill,” Greentech Media, December 2, 2016, available at https://www.greentechmedia.com/articles/read/clean-energy-advocates-praise-passage-of-major-illinois-energy-bill.
  77. Kari Lydersen, “Illinois Energy Bill: After Race to the Finish, What Does It All Mean?”, Midwest Energy News, December 8, 2016, available at http://midwestenergynews.com/2016/12/08/illinois-energy-bill-after-race-to-the-finish-what-does-it-all-mean; Monique Garcia, “Legislature Passes ComEd Rate Hike to Bail Out Nuclear Power Plants, but Little Else,” Chicago Tribune, December 1, 2016, available at http://www.chicagotribune.com/news/local/politics/ct-bruce-rauner-comed-exelon-rate-hike-met-1203-20161201-story.html.
  78. Rich Miller, “Rauner/GOP Budget Would Sweep ‘Every Penny’ From Ratepayer-Funded Solar Program,” Capitol Fax, June 26, 2017, available at https://capitolfax.com/2017/06/26/raunergop-budget-would-sweep-every-penny-from-ratepayer-funded-solar-program.
  79. U.S. Energy Information Administration, State Carbon Dioxide Emissions.
  80. Robert Duffer, “Chicago Vehicle Charging Infrastructure Boosted by VW Settlement,” Chicago Tribune, April 14, 2017, available at http://www.chicagotribune.com/classified/automotive/ct-chicago-ev-charging-stations-0415-20170415-story.html.
  81. Jon Hilkevitch, “CTA, Pace Brace for Rauner’s Proposed $130 Million Cuts,” Chicago Tribune, February 19, 2015, available at http://www.chicagotribune.com/ct-rauner-budget-transit-met-0219-20150218-story.html.
  82. GDP in chained 2009 dollars. Bureau of Economic Analysis, “Regional Data: GDP and Personal Income.”
  83. Calculations include state energy employment for energy efficiency, solar, wind, and hydroelectric generation jobs. U.S. Department of Energy, U.S. Energy and Employment Report, State Charts.
  84. Thompson and Bajaj, “The Green Energy Revolution Will Happen Without Trump.”
  85. U.S. Energy Information Administration, State Carbon Dioxide Emissions; United Nations Framework Convention on Climate Change, “U.S. Cover Note INDC and Accompanying Information.”
  86. U.S. Environmental Protection Agency, Data File: Goal Computation Appendix 1-5; U.S. Environmental Protection Agency, New Source Complements to Mass Goals.
  87. Ibid.
  88. Alternative Fuels Data Center, “Alternative Fueling Station Counts by State,” available at https://www.afdc.energy.gov/fuels/stations_counts.html (last accessed July 2017).
  89. Felicity Barringer, “California Sues E.P.A. Over Denial of Waiver,” The New York Times, January 3, 2008, available at http://www.nytimes.com/2008/01/03/us/03suit.html; Evan Halper and Chris Megerian, “Trump Wants to Shelve Fuel Mileage Rules, Inviting a Fight With California,” Los Angeles Times, March 15, 2017, available at http://www.latimes.com/politics/la-na-pol-trump-autos-20170315-story.html.
  90. Illinois General Assembly Legislative Research Unit, “Expiration and Vacancies: Governor” (2017), available at http://www.ilga.gov/commission/lru/gov.pdf; Illinois Climate Change Advisory Group, “GHG Emissions Standards for Cars” (2007), available at http://www.epa.state.il.us/air/climatechange/documents/subgroups/transportation/ghg-emissions-standards-for-cars.pdf.
  91. Stephen Edelstein, “Which States Follow California’s Emission and Zero-Emission Vehicle Rules?”, Green Car Report, March 7, 2017, available at http://www.greencarreports.com/news/1109217_which-states-follow-californias-emission-and-zero-emission-vehicle-rules; Alex Davies, “Want to Gut Emission Rules? Prepare for War With California,” Wired, March 8, 2017, available at https://www.wired.com/2017/03/want-gut-emission-rules-prepare-war-california.
  92. Detroit Regional Chamber, “Michigan’s Automotive Industry Is Alive and Well,” available at http://www.detroitchamber.com/econdev/chamber-initiatives/michauto-universal-name/the-auto-industry-in-michigan (last accessed July 2017); Bureau of Labor Statistics, “Automotive Industry: Employment, Earnings, and Hours,” available at https://www.bls.gov/iag/tgs/iagauto.htm (last accessed July 2017).
  93. Lauren Gibbons, “Snyder Says Trump’s Move to Reinstate Auto Emissions Review Is ‘Very Positive,’” MLive, March 15, 2017, available at http://www.mlive.com/news/index.ssf/2017/03/gov_rick_snyder_ag_bill_schuet_1.html; Melissa Burden and Melissa Nann Burke, “Trump to Revisit Fuel Rules, Meet With Snyder on Wed.,” The Detroit News, March 13, 2017, available at http://www.detroitnews.com/story/business/autos/2017/03/13/trump-revisit-fuel-rules-michigan/99148768.
  94. Joseph Lichterman, “Snyder, 14 Other Governors Warn Against Tough Fuel Economy Rules,” Crain’s Detroit Business, June 29, 2011, available at http://www.crainsdetroit.com/article/20110629/FREE/110629849/snyder-14-other-governors-warn-against-tough-fuel-economy-rules; The White House Office of the Press Secretary, “Obama Administration Finalizes Historic 54.5 MPG Fuel Efficiency Standards,” Press release, August 28, 2012, available at https://obamawhitehouse.archives.gov/the-press-office/2012/08/28/obama-administration-finalizes-historic-545-mpg-fuel-efficiency-standard.
  95. Robert Walton, “Down to the Wire, Michigan Passes Sweeping Renewable Energy, Retail Choice Reforms,” Utility Dive, December 26, 2016, available at http://www.utilitydive.com/news/down-to-the-wire-michigan-passes-sweeping-renewable-energy-retail-choice/432528; Andy Balaskovitz, “Aiming to Send a Message, Michigan Democrats Propose Stronger Clean Energy Standards,” Midwest Energy News, June 15, 2017, available at http://midwestenergynews.com/2017/06/15/aiming-to-send-a-message-michigan-democrats-propose-stronger-clean-energy-standards.
  96. U.S. Energy Information Administration, State Carbon Dioxide Emissions.
  97. U.S. Energy Information Administration, “Michigan State Energy Profile,” available at https://www.eia.gov/state/print.php?sid=MI (last accessed July 2017).
  98. U.S. Department of Energy, FY 2018 Congressional Budget Request: State Tables: Preliminary (2017), available at https://energy.gov/sites/prod/files/2017/05/f34/FY2018BudgetStateTable_0.pdf; U.S. Department of Energy, Weatherization Assistance Program (2017), available at https://energy.gov/sites/prod/files/2017/05/f34/wap_factsheet_FINAL.pdf; Jennifer Laird, Jessica Pac, and Christopher Wimer, “Dimming the Lights: Eliminating Energy Assistance Would Move 200,000 People Into Poverty, Hurting the Rural Poor the Most,” Poverty and Social Policy Brief 1 (1) (2017): 1–2, available at https://static1.squarespace.com/static/5743308460b5e922a25a6dc7/t/5911c8a19de4bbb96b920341/1494337700539/Poverty+and+Social+Policy+Brief_1_1.pdf; see also Eliza Schultz and Erin Auel, “The Trump Budget Will Worsen Climate Change While Hurting the Most-Affected Families,” Center for American Progress, May 19, 2017, available at https://www.americanprogress.org/issues/green/news/2017/05/19/432714/trump-budget-will-worsen-climate-change-hurting-affected-families.
  99. GDP in chained 2009 dollars. Bureau of Economic Analysis, “Regional Data: GDP and Personal Income.”
  100. Calculations include state energy employment for energy efficiency, solar, wind, and hydroelectric generation jobs. U.S. Department of Energy, U.S. Energy and Employment Report: State Charts.
  101. Thompson and Bajaj, “The Green Energy Revolution Will Happen Without Trump.”
  102. U.S. Energy Information Administration, State Carbon Dioxide Emissions; United Nations Framework Convention on Climate Change, “U.S. Cover Note INDC and Accompanying Information.”
  103. U.S. Environmental Protection Agency, Data File: Goal Computation Appendix 1-5; U.S. Environmental Protection Agency, New Source Complements to Mass Goals.
  104. Luke Tonachel, “Michigan, Missouri Support Strong Fuel Efficiency Standards,” Natural Resources Defense Council blog, May 25, 2017, available at https://www.nrdc.org/experts/michigan-missouri-support-strong-fuel-efficiency-standards.
  105. Lori Montgomery, “In Norfolk, Evidence of Climate Change Is in the Streets at High Tide,” The Washington Post, May 31, 2014, available at https://www.washingtonpost.com/business/economy/in-norfolk-evidence-of-climate-change-is-in-the-streets-at-high-tide/2014/05/31/fe3ae860-e71f-11e3-8f90-73e071f3d637_story.html; Jay Price, “Rising Seas Threaten Coastal Military Bases,” National Public Radio, March 31, 2017, available at http://www.npr.org/2017/03/31/522151922/rising-seas-threaten-coastal-military-bases; Laura Parker, “Who’s Still Fighting Climate Change? The U.S. Military,” National Geographic, February 7, 2017, available at http://news.nationalgeographic.com/2017/02/pentagon-fights-climate-change-sea-level-rise-defense-department-military.
  106. U.S. Energy Information Administration, Electric Power Monthly With Data for December 2016; U.S. Energy Information Administration, “Virginia Electricity Profile 2015,” (2017), available at https://www.eia.gov/electricity/state/Virginia.
  107. U.S. Department of Energy, U.S. Energy and Employment Report: State Charts; Thompson and Bajaj, “The Green Energy Revolution Will Happen Without Trump.”
  108. GDP in chained 2009 dollars. Bureau of Economic Analysis, “Regional Data: GDP and Personal Income.”
  109. Calculations include state energy employment for energy efficiency, solar, wind, and hydroelectric generation jobs. U.S. Department of Energy, U.S. Energy and Employment Report: State Charts.
  110. Thompson and Bajaj, “The Green Energy Revolution Will Happen Without Trump.”
  111. U.S. Energy Information Administration, State Carbon Dioxide Emissions; United Nations Framework Convention on Climate Change, “U.S. Cover Note INDC and Accompanying Information.”
  112. The Clean Power Plan goal calculations set a power sector emissions goal that is 7 percent higher than the 2012 baseline for Virginia. U.S. Environmental Protection Agency, Data File: Goal Computation Appendix 1-5; U.S. Environmental Protection Agency, New Source Complements to Mass Goals.
  113. Virginia.gov, “Governor McAuliffe Statement on President Trump’s Decision to Leave the Paris Climate Agreement,” Press release, May 31, 2017, available at https://governor.virginia.gov/newsroom/newsarticle?articleId=20402; Washington Governor Jay Inslee, “United States Climate Alliance Adds 10 New Members to Coalition Committed to Upholding the Paris Accord”; We Are Still In, “Open Letter to the International Community and Parties to the Paris Agreement From U.S. State, Local, and Business Leaders.”
  114. Fenit Nirappil, “Va. Democratic Gubernatorial Hopefuls Vow to Defy Trump on Climate Change,” The Washington Post, June 2, 2017, available at https://www.washingtonpost.com/local/virginia-politics/va-democratic-gubernatorial-hopefuls-vow-to-defy-trump-on-climate-change/2017/06/02/c1de8dd2-47c4-11e7-98cd-af64b4fe2dfc_story.html.
  115. Patricia Sullivan, “McAuliffe Proposes Statewide Carbon Cap,” The Washington Post, May 16, 2017, available at https://www.washingtonpost.com/local/virginia-politics/mcauliffe-proposes-statewide-carbon-cap/2017/05/16/7eda81f6-39bb-11e7-a058-ddbb23c75d82_story.html.

The positions of American Progress, and our policy experts, are independent, and the findings and conclusions presented are those of American Progress alone. A full list of supporters is available here. American Progress would like to acknowledge the many generous supporters who make our work possible.

Authors

Luke Bassett

Associate Director, Domestic Energy and Environment Policy

Christy Goldfuss

Former Senior Vice President, Energy and Environment Policy