New County-by-County Analysis of the Arizona’s Election Administration in the 2012 Election
Listen to today’s press call here.
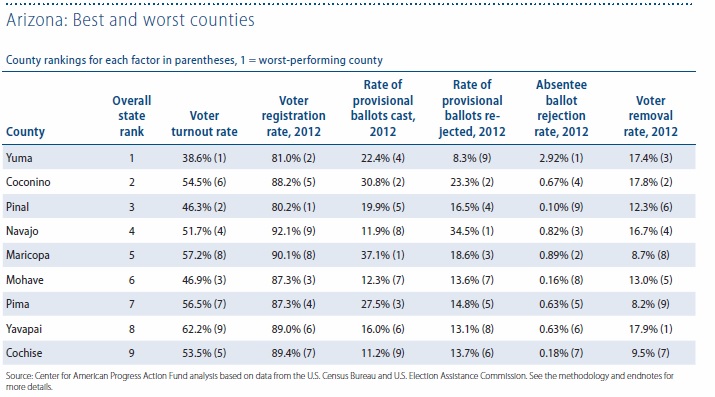
Washington, D.C. – The Arizona counties with the worst voting access are Yuma, Coconino, and Pinal, according to a new report released today by the Center for American Progress Action Fund. The report identifies Arizona’s best and worst performers for voting access and voter experience by looking at six factors that reflect voters’ ability to participate in the democratic process: voter turnout, overall voter registration rate, rate of registered voters purged from voting rolls, provisional ballots cast, provisional ballots rejected, and absentee ballots rejected.
In addition to examining Arizona’s worst election offenders, the report offers county-by-county analysis of 16 other swing states—states with the smallest margin of victory between the two presidential candidates in 2012: Colorado, Florida, Georgia, Indiana, Iowa, Michigan, Minnesota, Missouri, Nevada, New Hampshire, New Mexico, North Carolina, Ohio, Pennsylvania, Virginia, and Wisconsin. The report finds that with election administration delegated to officials and boards in more than 3,000 counties and localities in the United States, the ease with which one exercises his or her right to vote can depend on where he or she lives. This pattern played out in every state that was analyzed.
Key findings from the report include:
- Yuma and Pinal counties both performed very poorly on the overall registration rate as well as voter turnout. Pinal had the worst registration rate in the state, while Yuma had the second-worst registration rate. On voter turnout, Yuma performed the poorest, followed by Pinal. Both counties had voter turnout up to 25 percent lower than the state average.
- Meanwhile, Coconino County had the second-highest rate of provisional ballots cast in the state, the second-highest rate of provisional ballots rejected, and the second-highest rate of voters removed from the voting rolls.
- Finally, Maricopa County stood out for having the highest rate of provisional ballots in the state. More than 37 percent of the ballots cast on Election Day 2012 in Maricopa County were provisional ballots—a rate that was 76 percent higher than the state average.
The report’s findings provide insights that can help officials, policymakers, and advocates better understand voting administration practices that work. By comparing voter access and experience across Arizona’s counties, officials can determine the best practices for ensuring that citizens have an equal opportunity to participate in the democratic process.
Read the report: Unequal Access: A County-by-County Analysis of Election Administration in Swing States in the 2012 Election by Anna Chu, Joshua Field, and Charles Posner
To speak with experts on this issue, please contact Madeline Meth at [email protected] or 202.741.6277.
###